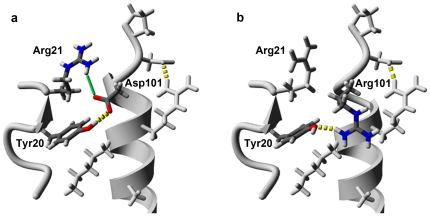
Figure 4. Residue 101 Interaction Analysis.
A partial ribbon diagram of the peptide backbone is shown with neighboring side chains rendered as stick figures. Residue 101 and interacting partners are differentially colored: Carbon-grey; Hydrogen-white; Nitrogen-blue; Oxygen-red. (a) The local environment of Asp101 in the double mutant structure (PDB file 3LN2). At image center, a carboxylate oxygen of Asp101 is 3.36 Å from a guanidino amine of Arg21 resulting in an electrostatic N-O bridge (green line) [19]. At the same time, the Asp101 side chain is within hydrogen bonding distance of Tyr20's phenolic group (broken yellow line, 2.67 Å O-O distance). (b) The local environment of Arg101 in wild type hLYS (PDB file 1JWR) [32]. At image center, the wild type Arg101 is able to hydrogen bond with Tyr20 (broken yellow line, 2.92 Å N-O distance), but orients away from Arg21 as a result of electrostatic repulsion. Images rendered with YASARA Structure v9.10.5.

