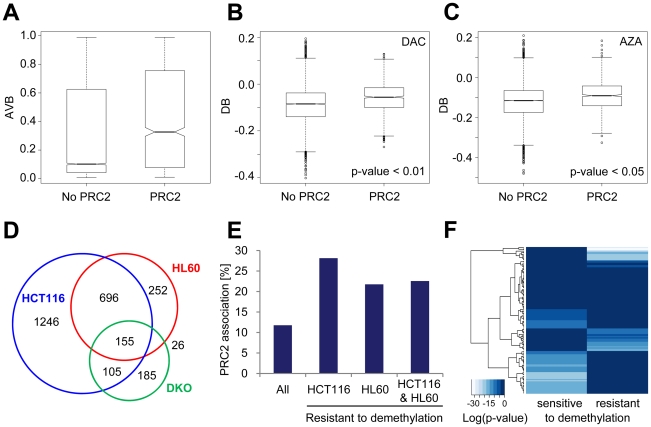
Figure 7. The chromatin environment may modify drug-induced demethylation efficiency.
A, Boxplots show the distribution of CG methylation in PRC2-associated CGs and non-PRC2-associated CGs in HL60 cells. B, C, Boxplots show demethylation efficiency indicated by DB values in AZA- and in DAC-treated HL60 cells dependent on association with PRC2 components. For A, B, and C black lines denote medians, notches the standard errors, boxes the interquartile range, and whiskers the 2.5th and 97.5th percentiles. D, Venn diagrams indicate CGs which did not become demethylated (AVB≥0.8) in drug treated HCT116 and HL60 cells and in DKO cells, respectively. E, Percentage of demethylation-resistant CGs associated with PRC2 components in HCT116 and HL60 cells, and for overlapping CGs of both cell lines (HCT116 & HL60). F, Significance of enrichment of transcription factor binding sites in genes with demethylation-resistant CGs in HCT116 and HL60 cells and with CGs that became demethylated by AZA and DAC in HCT116 and HL60 cells (sensitive to demethylation). Heatmap columns represent log (P values) for enrichment of 130 transcription factors.

