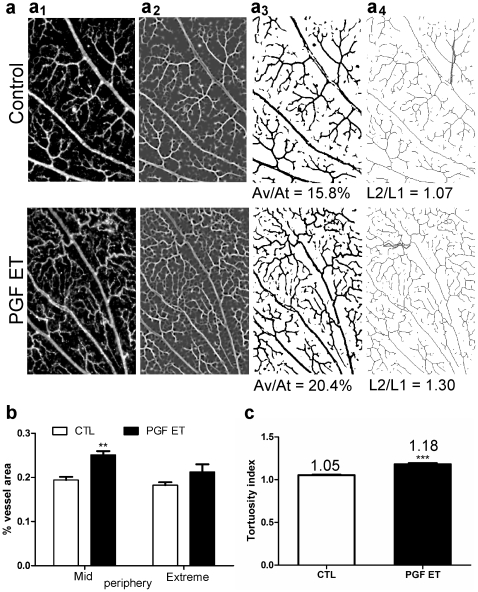
Figure 3. Morphological analysis of flat-mounted retina labeled with FITC-conjugated lectin from Bandeira simplicifolia.
(a) Illustration of the procedure followed with “ImageJ” software. (a1) Selection of seven areas per group, in mid (700x500 px) and extreme (400x300 px) peripheries on mosaics (3007x2904 px) made with microscopic images at low magnification (x4). (a2) Application of steerable filters for ridge detection in the selected image, with the plug-in “Feature Detector” [57]. (a3) Transformation of the filtered image into a binary image allowing selection of the retinal vessels to calculate the vascularized area (area covered by vessels out of total area, Av/At). (a4) Derivation of the vascular skeleton from the binary image, using the procedure “skeletonizes”. This second binary picture was used to calculate the tortuosity index corresponding to the ratio: real vessel length (L2, in red) out of the length of an imaginary straight line on the measured vessel (L1, in blue) as shown in d1 and d2. (b–c) Quantitative analysis of the retinal vasculature from control (CTL) and PGF ET-treated eyes. (b) Vascularized area calculated from the binary images which are illustrated in c1 and c2. All data: CTL, 18.8%±0.5%; PGF-ET, 23.7%±1.1%; ** p = 0.0034. Mid periphery: CTL, 19.4%±0.7%; PGF-ET, treated eyes 25.1%±0.8%; Bonferroni, ** p<0.01. Extreme periphery: CTL, 18.2%±0.7%; PGF-ET treated eyes 21.2%±1.7%; Bonferroni, ns. (c) Tortuosity index of capillaries calculated from the second binary images. CTL, controls 1.053±0.005; PGF-ET, treated eyes 1.180±0.014; *** p<0.0001; PGF ET/CTL = 1.12.

