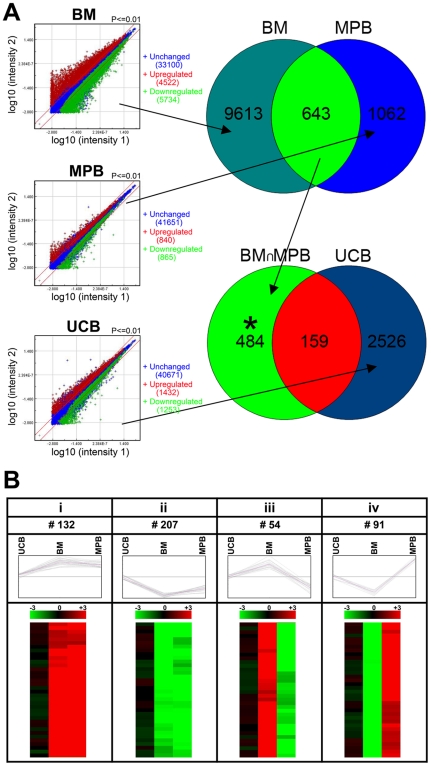
Figure 2. Genomic analysis of human BM, CB, and MPB CD34+ cells in different phases of cell cycle.
(A) Microarray analyses of G0CD34+ and G1CD34+ cells from BM, MPB, and UCB (3 replicates per group, total of 18 samples) were carried out using Agilent whole human genome oligo chips. The signal intensities from the single-experiment raw data lists were normalized by dividing the intensity values by their median. Standard deviation and p-values were calculated for each probe. The differentially expressed genes with at least two fold change and p-value<0.01 were considered as differentially expressed genes. Among the 43,356 total analyzed genes, 10256, 1705, and 2685 genes were differentially expressed between G0 and G1 cells of BM, MPB, and UCB, respectively. In order to identify target genes related to engraftment, common differentially expressed genes between G0 and G1 from both BM and MPB were identified (643 genes). A total of 159 differentially genes between G0 and G1 cells of UCB were common with these 643 genes. Considering that these 159 genes were related to progression of cells from G0 to G1 and therefore not involved in engraftment, our analysis focused on the difference between these two sets of genes, namely, 484 genes (643−159 = 484). * = target genes. (B): Gene clustering analyses of 484 target genes were done using open source software TM4 MultiExperiment Viewer (version 4.3). Out of 484 differentially regulated genes, (i) 132 genes were upregulated in G0 cells of both BM and MPB (unchanged in UCB), and (ii) 207 genes were upregulated in G1 cells of both BM and MPB (unchanged in UCB). The remaining genes displayed as aberrant expression patterns. (iii) 54 genes were upregulated in BM G0 cells and MPB G1 cells, and (iv) 91 genes were upregulated in BM G1 and MPB G0 cells.

