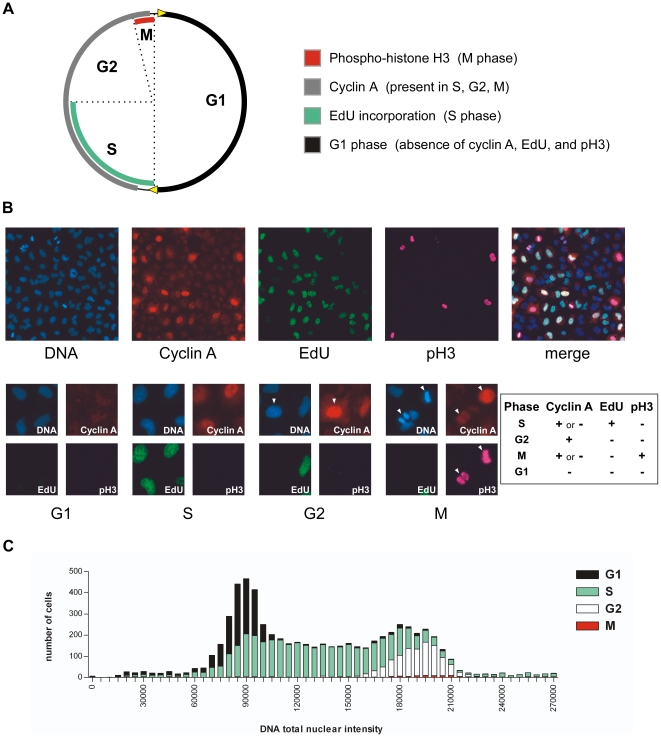
Figure 1. Development of the high-content (HC) cell cycle assay.
(A) Markers used in the HC cell cycle assay and their distribution during the cell cycle. As defined by the HC cell cycle assay, G1 phase formally includes both G0 and G1 phases—however, for the sake of simplicity, we refer to it as “G1” rather than “G0/G1”. See text for discussion of assay development and validation. (B) Images of A549 cells stained for HC cell cycle analysis with Hoechst 33342, cyclin A, EdU, and pH3. Top panel, a field of asynchronous cycling cells; bottom panel, examples of G1, S, G2, and M cells. Bottom panels: the G2 panel shows one G2 cell (white arrowhead), one G1 cell, and one S cell; the M panel shows two M cells (white arrowheads) and three G1 cells. The G1 and S panels show exclusively G1 or S cells, respectively. The inset table summarizes the Boolean logic used to identify cell cycle phases when images are analyzed with the Cellomics Target Activation algorithm. (C) A DNA distribution plot of data derived from HC cell cycle analysis of DMSO-treated Calu-6 cells. This plot combines aspects of FACS (DNA content, as measured by total nuclear intensity of Hoechst 33342 staining) with the image-based cell cycle phase assignment, and demonstrates that the phase assignments correlate well with the DNA content expected for a given phase (i.e. G1 lies primarily at 2N; S lies between 2N and 4N, G2+M lies primarily at 4N). Note that complex karyotypes in some cell lines can contribute to a complex distribution, such that each phase is not completely contained within discrete boundaries of 2N-4N DNA content.

