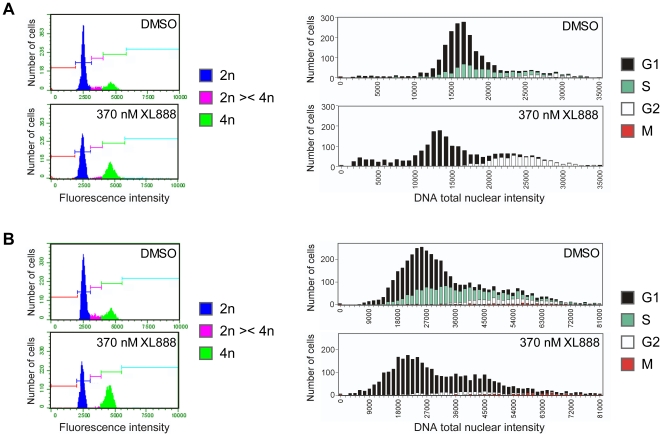
Figure 2. Comparison of HC cell cycle analysis to FACS analysis.
(A) WM-266-4 cells were treated for 24 h with DMSO or 370 nM XL888: FACS analysis (left panel) of XL888-treated cells shows 4N accumulation and a decrease in S phase. HC cell cycle analysis (right panel) similarly shows that XL888 treatment resulted in G2 (4N) accumulation and loss of S cells, and also reveals the presence of a population of sub-2N dead/dying cells. (B) A375 cells were treated for 24 h with DMSO or 370 nM XL888. FACS analysis (left panel) of XL888-treated cells shows loss of S, some loss of 2N, and 4N accumulation. HC cell cycle analysis (right panel) similarly shows that XL888 treatment resulted in a loss of S and moderate loss of G1. However, HC analysis additionally revealed that the increase in 4N (seen in the parallel FACS analysis) is due to not to accumulation of G2 or M cells, but to the generation of 4N-pseudo-G1 cells, most likely by mitotic checkpoint slippage. Experiments were performed at least two times, and results from independent trials were consistent.

