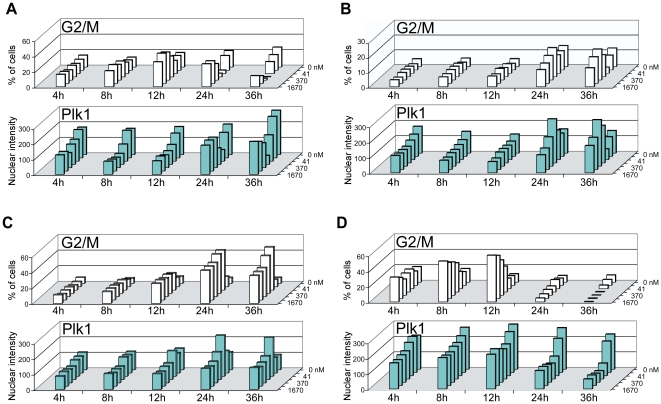
Figure 7. Timecourse analysis of cell cycle profiles and PLK1 levels.
Cells were treated with the indicated concentrations of XL888 (14, 41, 123, 370, 1110, 1670 nM) at time = 0. Plates were then fixed at 4, 8, 12, 24, or 36 h and stained for a modified version of HC cell cycle analysis that allows for simultaneous detection of cell cycle phenotypes and of an additional marker protein, PLK1. For a given cell line, profiles of %G1 and %S were nearly identical to the %G1 and %S data shown in Figure 5, so those data are not displayed here; see Figure 5 for reference. See text for discussion. (A) CHL-1 (B) EBC-1 (C) A549 (D) A375. For all three cell lines, 17-AAG effects were similar to those of XL888 (data not shown). Experiments were performed at least two times, and results from independent trials were consistent.

