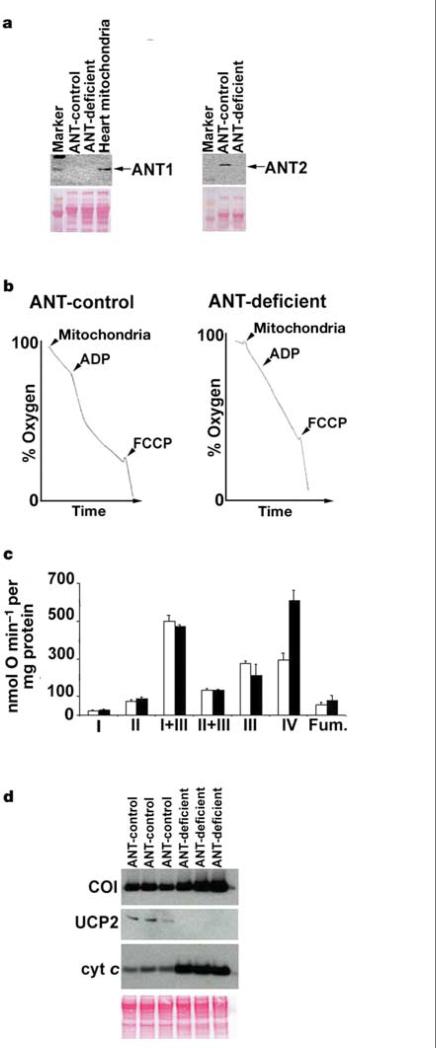
Figure 2.
Inactivation of ANT in liver mitochondria. a, Western blots of mitochondria using ANT1 and ANT2-specific antibodies. Heart mitochondria are a positive ANT1 control. ANT1 and ANT2 are both 30 kDa (arrows). The Ponceau-S-stained blot (below) is the loading control. b, ADP-stimulated mitochondrial respiration. Arrowheads denote addition of 600 μg of mitochondrial protein, 125 nmol of ADP and 75 nM FCCP. c, OXPHOS enzyme activities of ANT-control (white bars) or ANT-deficient (black bars) liver mitochondria (mean of three mice each). OXPHOS complexes I–IV and fumarase (Fum.) are shown. Error bars show the standard error. d, Western blots of mitochondria from three independent mice for COI (56 kDa), UCP2 (33 kDa), cytochrome (cyt) c (11 kDa). The Ponceau S blot (below) is the loading control.

