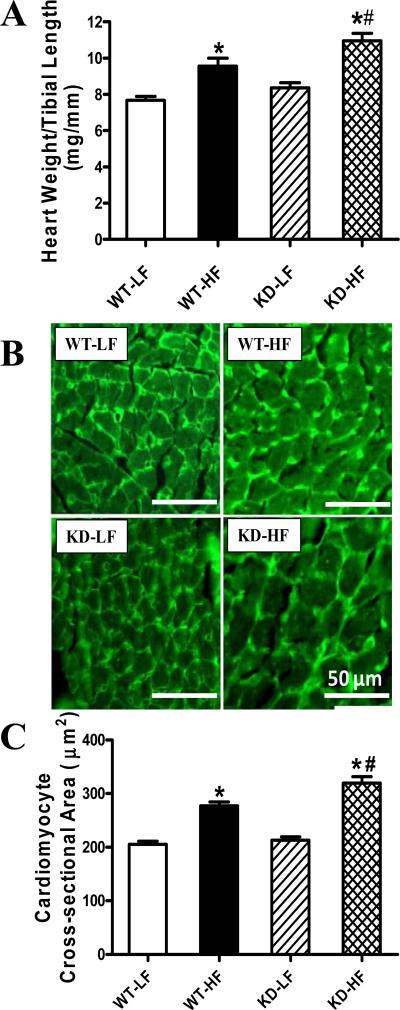
Fig. 2.
Analysis of cardiac hypertrophy in hearts from WT and AMPK KD mice with low fat (LF) or high fat (HF) diet intake. A: Normalization of heart weight to tibial length from LF- or HF-fed WT and AMPK KD mice; B: FITC-conjugated wheat germ agglutinin immunostaining depicting transverse sections of left ventricular myocardium from LF- or HF-fed WT and KD mice (magnification, ×400); C: Quantitative analysis of cardiomyocyte cross-sectional (transverse) area in ~ 200 cells from 4 - 5 mice per group, Mean ± SEM, n = 13-15 mice per group, * p < 0.05 vs. WT-LF group, # p < 0.05 vs. WT-HF group.

