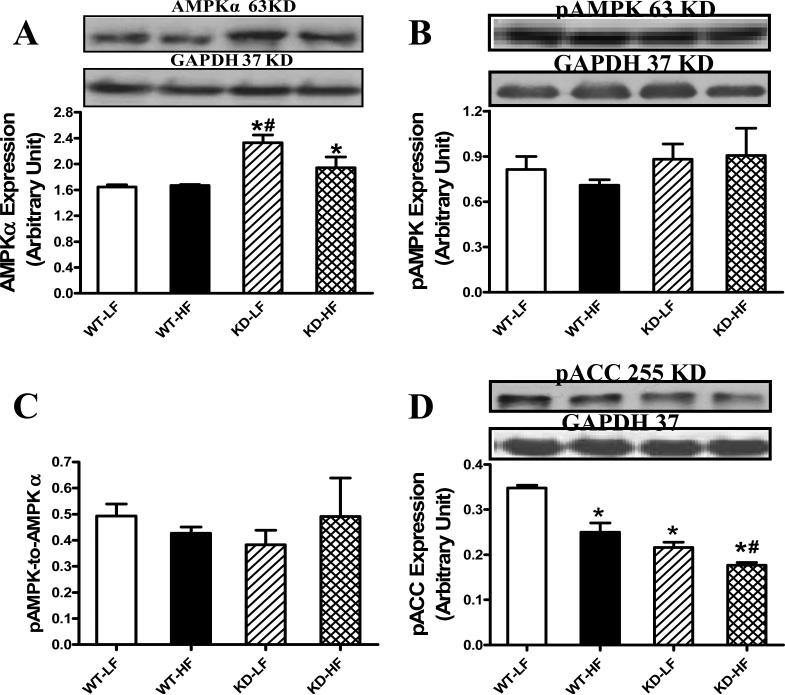
Fig. 6.
AMPK expression as well as activation of AMPK and ACC in myocardium from low fat (LF) and high fat (HF)-fed WT and AMPK KD mice. A: AMPKα; B: pAMPK; C: pAMPK/AMPK ratio; and D: pACC. Inset: Representative gel blots depicting AMPKα, pAMPK, pACC and GAPDH (loading control) using specific antibodies. Mean ± SEM, n = 4, * p < 0.05 vs. WT-LF group, # p < 0.05 vs. WT-HF group.

