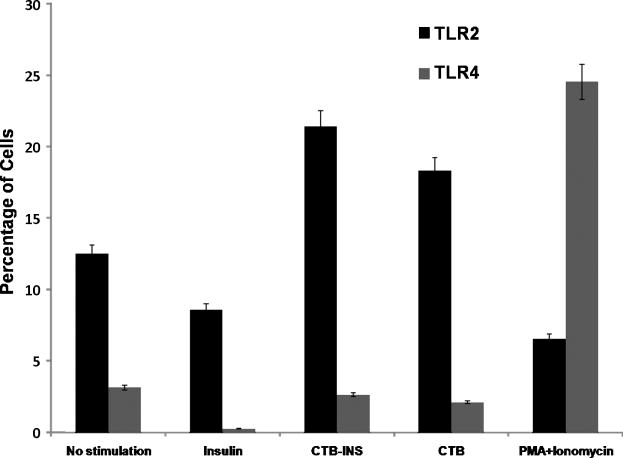
Figure 2. TLR2 upregulation by CTB-INS.
The bar graph represents the percentages of dendritic cells expressing Toll like Receptors 2 (TLR2) and Toll like Receptor 4 (TLR4). Umbilical cord blood monocyte derived Immature DC were stimulated for 48 hours with CTB, CTB-INS, Insulin and PMA Ionomycin and the induction of TLR2(CD282) and TLR4(CD284) determined by flow cytometric TLR specific antibody surface staining methods. The mean and standard error of the mean (SE) were calculated for three separate experiments (p<0.05).

