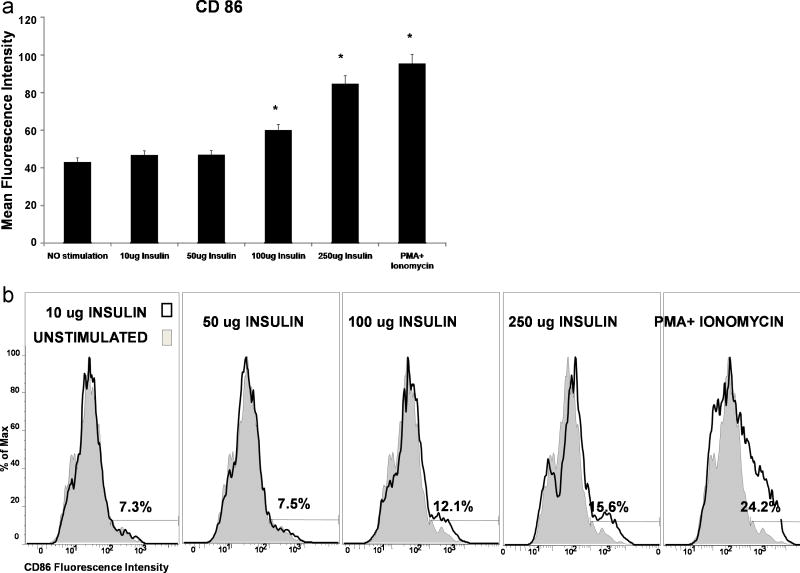
Figure 5. Increasing Insulin Dosage Results in DC Activation.
Immature monocyte derived DCs were stimulated for 48 hours with different amounts of insulin and PMA Ionomycin. Activation of DCs was determined by flow cytometric methods. The data presented are representative of more than three independent experiments with comparable results. (Panel A) Graph indicating increasing mean fluorescence intensity of CD86 expression on DC cell surfaces with increasing amounts of Insulin. (Panel B) is a histogram showing the percentages of cells activated by different concentrations of insulin as measured by CD86 costimulatory factor expression on the DC cell surface.

