Abstract
OBJECTIVES
A defining feature of peristalsis is propagation velocity, which determines the timing of the distal contraction relative to the swallow. This study aimed to exploit a coordinate-based strategy to quantify the normal latency of the distal esophageal contraction as a measure of propagation velocity optimized for high-resolution esophageal pressure topography (EPT) studies.
METHODS
EPT studies for 75 healthy volunteers were merged in a computer simulation. Swallows were synchronized and analyzed as a 100 × 200 pixel grid that normalized esophageal length from the pharynx to the stomach for a 20-s period to first calculate a composite for each individual and then to establish normative values for the morphology and latency of the distal contraction among individuals.
RESULTS
Stereotyped landmarks in composite EPT studies were pressure troughs in the proximal and distal esophagus isolating the distal segment and the contractile deceleration point (CDP) localizing the termination of peristalsis in the distal segment. Distal contractile latency was timed to the CDP (median 6.0 s, 95% confidence interval 4.8–7.6 s) and to lower esophageal sphincter (LES) contraction (median 9.2 s, 95% confidence interval 6.5–11.5 s). Illustrative examples are shown of rapidly conducted contractions with normal or short latency, suggesting short latency to be the preferable EPT metric of rapid propagation.
CONCLUSIONS
The proposed scheme, utilizing the topographic coordinates of contraction relative to the swallow as an alternative to conventional measures of peristaltic velocity, lays the foundation for a physiologically grounded classification of peristaltic abnormalities in EPT. Future studies will test the clinical utility of this scheme.
INTRODUCTION
Propagation of esophageal peristalsis is a function of neural control mechanisms. In the distal esophagus and in the lower esophageal sphincter (LES), the deglutitive contraction is controlled through the myenteric plexus, which contains both excitatory and inhibitory ganglionic neurons (1,2). Current thinking is that both populations of neurons are activated by vagal efferent nerves, but because of increasing dominance of inhibitory ganglionic nerves in the distal esophagus, the timing of the peristaltic contraction is progressively delayed (3). It follows from this physiology that a defining feature of normal peristalsis is of progressively increasing latency of the deglutitive contraction in the distal esophagus relative to time of the swallow.
Pathophysiological processes selectively compromise peristalsis based on the specific structures affected (neuronal or muscular). The most obvious example of inhibitory neuronal dysfunction is the impairment of LES relaxation in achalasia (4,5). However, testing the integrity of inhibitory innervation in the adjacent esophagus that is devoid of resting tone is more difficult (6). With conventional manometry, the most common metric applied is the propagation velocity of the peristaltic wavefront. Rapid contractions are thought indicative of dysfunctional inhibitory innervation. However, with the advent of high-resolution esophageal pressure topography (EPT), it becomes apparent that there is considerable variability in peristaltic conduction velocity, both regionally along the esophagus of a given individual and among individuals. Hence, applying this measure, many seemingly normal individuals are found to have rapidly propagated contractions, suggesting the need for a more discriminative metric.
A candidate metric for assessing propagation of peristalsis in EPT is the latency of the contraction in the distal esophagus. Behar and Biancani (7) initially established the relationship between simultaneous contractions and reduced latency of contractions and proposed this to be indicative of impaired deglutitive inhibition as can be seen in diffuse esophageal spasm (DES). However, thus far, the focus of analysis in clinical motility studies has remained on the propagation velocity. Consequently, the goal of this exploratory study was to exploit a coordinate-based strategy for analyzing EPT recordings based on our current physiological understanding of peristalsis, defining the latency of the distal esophageal contraction. The study is intended to lay the foundation for a physiological classification of peristaltic disorders based on the timing rather than the propagation velocity of the distal esophageal contraction.
METHODS
Subjects
High-resolution manometry (HRM) studies of 75 healthy volunteers (40 males, mean age 27 years, range 19–48 years) were used for this analysis. Volunteers were recruited by advertisement or word of mouth and had no history of gastrointestinal symptoms (heartburn, regurgitation, dysphagia), previous surgery, or significant medical conditions. Recent clinical EPT studies were also reviewed to illustrate the clinical relevance of the proposed coordinate-based strategy for analyzing EPT recordings. The study protocol was approved by the institutional review board of the Northwestern University and informed consent was obtained from each subject.
HRM protocol
HRM studies were done with a 4.2-mm outer diameter solid-state assembly with 36 circumferential sensors spaced at 1-cm intervals (Sierra Scientific Instruments, Los Angeles, CA) (8). Before recording, transducers were calibrated at 0 and 300 mm Hg using externally applied pressure. Studies were done in a supine position after at least a 6-h fast. The manometry assembly was placed transnasally and positioned to record from the hypopharynx to the stomach with about three intragastric sensors. The catheter was fixed in place by taping it to the nose. The manometric protocol included a 5-min period to assess basal sphincter pressure and ten 5-ml water swallows.
Normalization of HRM studies to generate a simulation of pressure topography
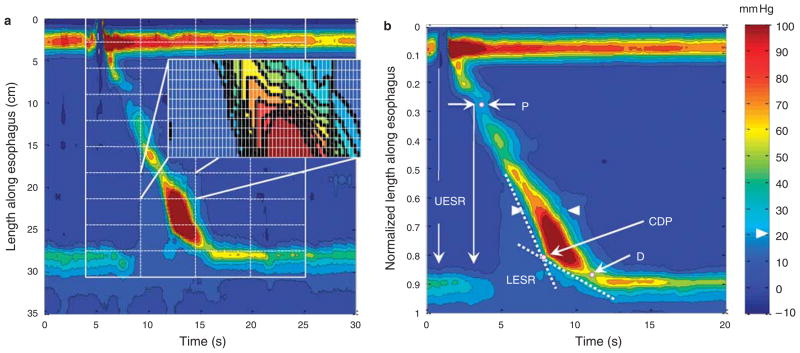
Pressure topography data from water swallows for each subject were exported from ManoView (Sierra Scientific Instruments, CA) in ASCII format for use in MATLAB (The Math Works, Natick, MA), a computer program customized for processing binary data. Instances of failed peristalsis were noted, but not included in the normalization process. A MATLAB program was written that analyzed each swallow as a 100 ×200 pixel grid extending from the last sensor in the pharynx to first sensor in the stomach for a 20-s period beginning 1 s before upper esophageal sphincter (UES) relaxation, thereby normalizing both the length of the esophagus among subjects and the time frame. Each pixel thus had coordinates of 1–100th percentile of esophageal length and 0.0–20.0 s in 0.1 s time increments (Figure 1a). A composite simulation of the EPT for each subject was then computed based on the median pressure value within each pixel for up to ten test swallows, depending on the occurrence of failed peristalsis (Figure 1b). Combining the composite simulations of individual subjects then derived the normal configuration of EPT among the study group. This was also accomplished with a MATLAB program that derived and plotted the 5th, 25th, 50th, 75th, and 95th percentile values for each pixel in the 100 × 200 coordinate grid among the 75 individual composite simulations.
Figure 1.
Generation of composite esophageal pressure topography. (a) The methodology for deriving normalized pressure topography of peristalsis. A virtual grid was created in MATLAB encompassing a 20-s period beginning 1 s prior to upper esophageal sphincter (UES) relaxation and spanning from one sensor above the UES to the first intragastric sensor. The exploded rectangle illustrates the fine gradations of the grid that divided the topography plot into 100×200 pixels in total, each representing 1% of esophageal length (0.01 in a) and 0.1 s time. The median pressure within each pixel was then extracted to compare with the corresponding pixel from other swallows to create a composite esophageal pressure topography (EPT) pattern for each subject. The ten swallow composite of a single subject is illustrated in b. Isobaric contours are highlighted in black at 10 mm Hg increments referenced to atmospheric pressure. Arrowheads delineate the 20-mm Hg isobaric contour. A proximal (P) and distal (D) pressure troughs are distinguished on the EPT. Lower esophageal sphincter (LES) relaxation (LESR) begins with the swallow (1 s) but does not achieve its nadir until after the trough. The two dashed lines represent approximate tangents to the initial and terminal portions of the 30-mm Hg isobaric contour. Their intersection defines the contractile deceleration point (CDP).
Data analysis
The primary focus of data analysis was the 75-subject EPT simulation, a data set summarizing the characteristics of 720 swallows. Pressure values from each pixel within the 100×200 pixel grid of that simulation morphology were analyzed non-parametrically to establish the 5th, 25th, 50th, 75th, and 95th percentile values within to further characterize these aspects of the 75-subject simulation. Particular emphasis was placed on the coordinates of the 20 mm Hg isobaric contour defined in each of these simulations in view of prior studies establishing this to be a reliable discriminator between the intrabolus domain and luminal closure at the onset on contractile activity (9,10). The location of the 20 mm Hg isobaric contour is arrowed in Figure 1b.
Landmarks and summary metrics
Normalized esophageal length in the EPT simulations was expressed as a percentage, with 0 being the pharyngeal limit and 1 (100%) being the intragastric limit. None of these normal controls had a hiatal hernia, and hence 100 % was also distal to the crural diaphragm. When converting normalized units to cm, the median esophageal length among subjects was used to calculate the conversion factor. Time (1 s) in the simulations was uniformly established as the time during deglutitive UES relaxation at which the 20 mm Hg isobaric contour was broken. Other noteworthy landmarks were the proximal and distal pressure troughs, indicated by P and D in Figure 1b, and the contractile deceleration point (CDP). The CDP represents the inflexion point at which the propagation velocity of the contraction distinctly changed. The CDP demarcates the early region of the distal esophageal contraction during which bolus clearance is mediated by esophageal peristalsis from the later region during which ampullary emptying is occurring (11). The CDP is localized objectively by fitting two tangential lines to the initial and terminal portions of the 30-mm Hg isobaric contours and noting intersection of the lines (11) (Figure 1).
Key metrics previously developed for analysis of clinical EPT studies include the integrated relaxation pressure (IRP) (12) and the distal contractile integral (DCI) (13). The IRP quantifies LES relaxation both in completeness and persistence. It reports the lowest mean EGJ pressure for 4 s, contiguous or non-contiguous, in the 10-s period following deglutitive UES relaxation. The normal range of the IRP with this instrumentation is <15mmHg (12). The DCI reflects the magnitude of the distal esophageal contraction exclusive of the LES. Conceptually, the DCI is the volume of the contraction between P and D in Figure 1b greater than the 20mmHg base expressed as mmHg·cm·s. The upper limit of normal for the DCI with this instrumentation is 5,000 mmHg·cm·s (13). Ranges for both the IRP and DCI were computed from the 75-subject simulations.
RESULTS
The 75-subject simulation
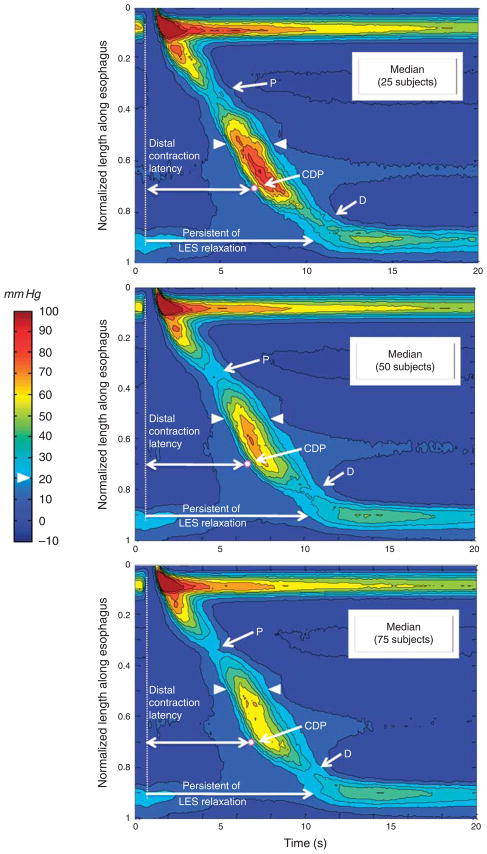
Figure 2 illustrates the progression of generating the EPT simulation, as 25, 50, and finally all 75 control subjects are progressively added to the single subject in Figure 1b. Consequently, the bottom panel of Figure 2 represents the median EPT pattern of all 720 (non-failed) peristaltic contractions in 75 control subjects. The process of adding subjects to the composite had the effect of essentially eliminating pressure signals not synchronized with the swallow, including respiration and contractions of the crural diaphragm, revealing a remarkably stereotyped pattern among subjects. Given the filtering out of the crural diaphragm contraction, the EGJ band in the simulation amounts to a relatively pure representation of the LES and deglutitive LES relaxation. The simulation process also had the effect of eliminating the pressure trough sometimes observed between troughs P and D (still slightly evident at the time of the arrowheads in the top panel of Figure 2) as this proved to be a highly variable feature among subjects and was averaged out by computing median pixel values in the composite.
Figure 2.
Successive addition of 25 (upper panel), 50 (middle panel), and 75 (bottom panel) composite esophageal pressure topography (EPT) plots from other subjects to the composite pressure topography. Each panel is constructed with the median 25, 50, or 75 pressure values in each of the 20,000 pixels (100×200) per the methodology illustrated in Figure 1. As in Figure 1, isobaric contours are highlighted in black at 10 mm Hg increments referenced to atmospheric pressure and arrowheads delineate the 20 mm Hg isobaric contour. The proximal (P) and distal (D) troughs were remarkably constant among individuals. Note in the top panel that a third pressure trough between P and D is slightly evident at the time of the arrowheads. The white dot indicates the median location of the contractile deceleration point (CDP) (0.7 normalized length unit in the 25-, 50-, and 75-subject composites). The vertical dashed line indicates upper esophageal sphincter (UES) relaxation. The top horizontal arrow represents the distal contraction latency and the bottom arrow the persistence of lower esophageal sphincter (LES) relaxation.
Lower esophageal sphincter
The effect of deglutition on LES pressure is evident in Figure 1b by the gradual decline in LES pressure after time 1 s, indicated by the vertical white arrow. Note that LES relaxation had not yet achieved a nadir at the onset of the distal peristaltic contraction (second vertical arrow in Figure 1b).
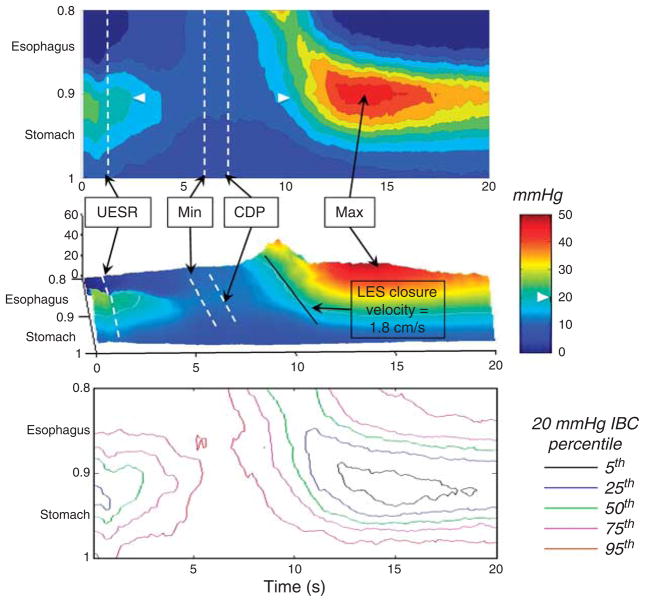
An expanded and recalibrated plot of the LES during deglutition in the 75-subject composite is illustrated in Figure 3, both as an isobaric contour plot (top panel) and as a landscape plot (center panel). The esophageal contraction displayed on Figure 3 is the post-CDP contraction and occurs during the period of ampullary emptying. The lower panel of Figure 3 illustrates variation among subjects, showing the coordinates of the 5th–95th percentiles of the 20 mm Hg isobaric contour. Indicated on the top panels are the timing of the swallow (1 s), the CDP, and the timing of maximal postdeglutitive LES contraction. Also indicated is an estimation of the rate of closure of the LES, progressing at ~ 1.8 cm/s. Table 1 summarizes key measures of deglutitive LES relaxation among the 75-subject group.
Figure 3.
Expanded and rescaled plot of the lower esophageal sphincter (LES) from the 75-subject composite (50th percentile) extending from the distal esophagus trough to the proximal stomach plotted in pressure topography (top) and landscape format (middle). Pressure increments of 5 mm Hg are demarcated on the isobaric contour plot with the 20 mm Hg isobaric contour indicated by the white arrowheads. Times of upper esophageal sphincter (UES) relaxation, contractile deceleration point (CDP), minimal LES pressure during deglutitive relaxation (Min), and maximal postdeglutitive contraction (Max) are noted. The LES closure velocity (1.8 cm/s) is estimated from the slope of the 20 mm Hg isobaric contour as it traverses the LES using the conversion of 1 normalized unit being equal to 31 cm. The lower panel illustrates the pressure topography coordinates for the 5th, 25th, 50th, 75th, and 95th percentiles of the 20 mm Hg isobaric contour for the 75-subject composite. Corresponding numerical data for this figure are summarized in Table 1.
Table 1.
Characterization of deglutitive LES relaxation in the EPT simulation of 75 control subjects
| Median | 5th–95th Percentile | |
|---|---|---|
| Integrated relaxation pressure (4-s IRP)a | 6.2 | 2.2–12.7 |
| Time of minimal LES pressure (from UES relaxation) (s) | 5.3 | 3.3–7.4 |
| Minimal LES pressure (mm Hg)a | 3.7 | 0.3–8.6 |
| Maximal LES relaxation (relative to pre-swallow pressure) (%) | 71% | 64–96% |
| Persistence of LES relaxation from UES relaxation to LES contraction (to 20 mm Hg) (s) | 9.2 | 6.5–11.5 |
EPT, esophageal pressure topography; IRP, integrated relaxation pressure; LES, lower esophageal sphincter; UES, upper esophageal sphincter.
These pressures are reported relative to intragastric pressure per convention. Unless otherwise noted, pressures are relative to atmospheric.
Esophageal peristalsis
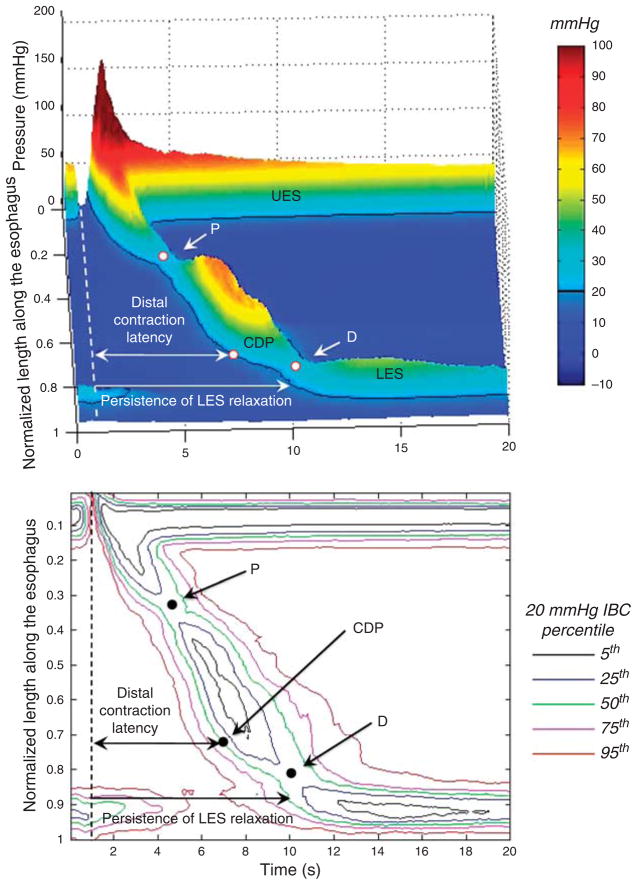
Figure 4 illustrates the distal esophageal contraction using the same concept as with the LES in Figure 3. The DCI is the total volume of contraction above the 20 mm Hg isobaric contour and demarcated proximally and distally by P and D, respectively. The timing of the CDP in Figure 4, demarcating the transition from peristaltic conduction to ampullary emptying, is the median location among the 75 subjects. The CDP uniformly occurred prior to the D trough. The lower panel of Figure 4 illustrates variation among subjects, illustrating the coordinates of the 5th–95th percentiles of the 20 mm Hg isobaric contour of contraction. Table 2 summarizes key measures of the peristaltic contraction among the 75-subject group. Metrics indicative of the latency of the distal esophageal contraction are the interval from UES relaxation to the CDP and to LES contraction. The median latency (5th–95th percentiles) to the CDP was 6.0 s (4.8–7.6) and to LES contraction was 9.2 s (6.5–11.5).
Figure 4.
Landscape plot of the 50th percentile of 75-subject composite pressure topography is shown in the upper panel. The dashed line represents the time upper esophageal sphincter (UES) relaxation. Proximal trough (P), contractile deceleration point (CDP), and distal trough (D) are identified in all the subjects. The distal contraction latency is measured from the onset of upper esophageal sphincter relaxation to the CDP. The persistence of lower esophageal sphincter (LES) relaxation is also indicated from the UES relaxation to LES contraction to 20 mm Hg. The corresponding pressure topography of the 5th, 25th, 50th, 75th, and 95th percentiles for the 20 mm Hg isobaric contour are illustrated in the lower panel.
Table 2.
Summary measures from the 75-subject composite
| Measure | Normalized length units median (5th–95th percentile) | Centimeters median (5th–95th percentile) |
|---|---|---|
| Esophageal lengtha | 1.0 | 31 (28–34) |
| Length to proximal trough (P)b | 0.35 (0.26–0.41) | 10.9 (8.1–12.8) |
| Length to CDP | 0.71 (0.54–0.83) | 20.1 (16.8–25.8) |
| Distal contraction latency (UES relaxation to CDP) (s) | 6.0 (4.8–7.6) | |
| Length to distal trough (D)b | 0.84 (0.79–0.87) | 26.1 (24.5–27.1) |
| Maximal peristaltic amplitude (mm Hg) | 73 (29–221) | |
| Maximal peristaltic amplitude location | 0.65 (0.6–0.7) | 20.2 (18.7–21.8) |
| DCI (mm Hg/cm/s) | 1,385 (363–4,720) | |
CDP, contractile deceleration point; DCI, distal contractile integral; UES, upper esophageal sphincter.
Measures pertaining to esophageal length are given both in normalized units with a value of one corresponding to 100% and as cm using a conversion ratio.
Measured from one sensor above the upper esophageal sphincter to the first sensor in the stomach.
P and D projection at the 20 mm Hg isobaric contour.
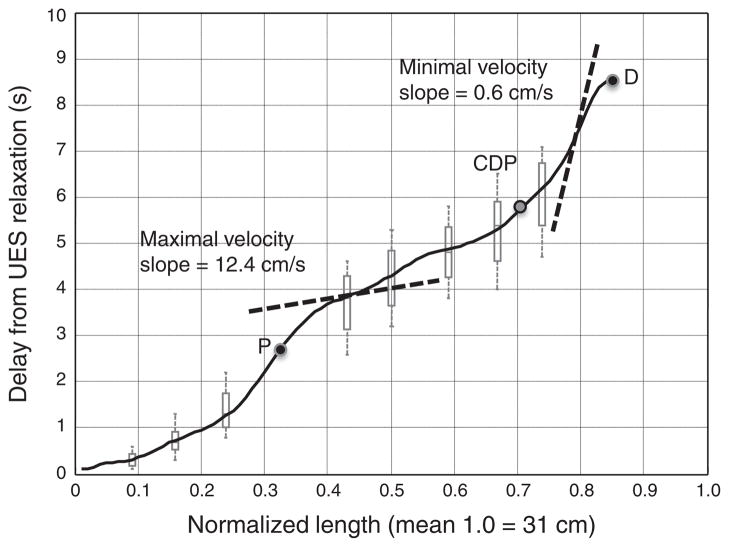
Another observation from the composite pressure topography was the variability of propagation velocity along the length of the esophagus. This feature is highlighted in Figure 5, which extracts the timing of onset of the 20 mm Hg isobaric contour from the 75-subject composite swallow. Propagation of the onset of contraction at a threshold pressure exceeding intrabolus pressure (20 mm Hg in this case) is the conventional means for deriving peristaltic velocity (14). Hence, instantaneous velocity at any location along the length of the esophagus is equal to the tangent of the curve in Figure 5, varying from a minimum of 0.6 cm/s to a maximum of 12.4 cm/s using the 50th percentile isobaric contour. The 95th percentile limits at each extreme would be 0.6 and 18.6 cm/s, respectively, suggesting limited utility of this conventional metric when applied to EPT.
Figure 5.
Timing of contraction onset (20 mm Hg isobaric contour) as a function of normalized length of the esophagus (black curve) with representative box-and-whisker brackets to demonstrate the 5th–95th percentile limits of this curve (gray). Median times of the proximal (P) and distal (D) pressure troughs and of contractile deceleration point (CDP) are indicated. Instantaneous contraction front velocity is equal to the derivative of this curve; the dashed line tangents illustrate maximum and minimum values, the slope of which equals instantaneous contraction velocity.
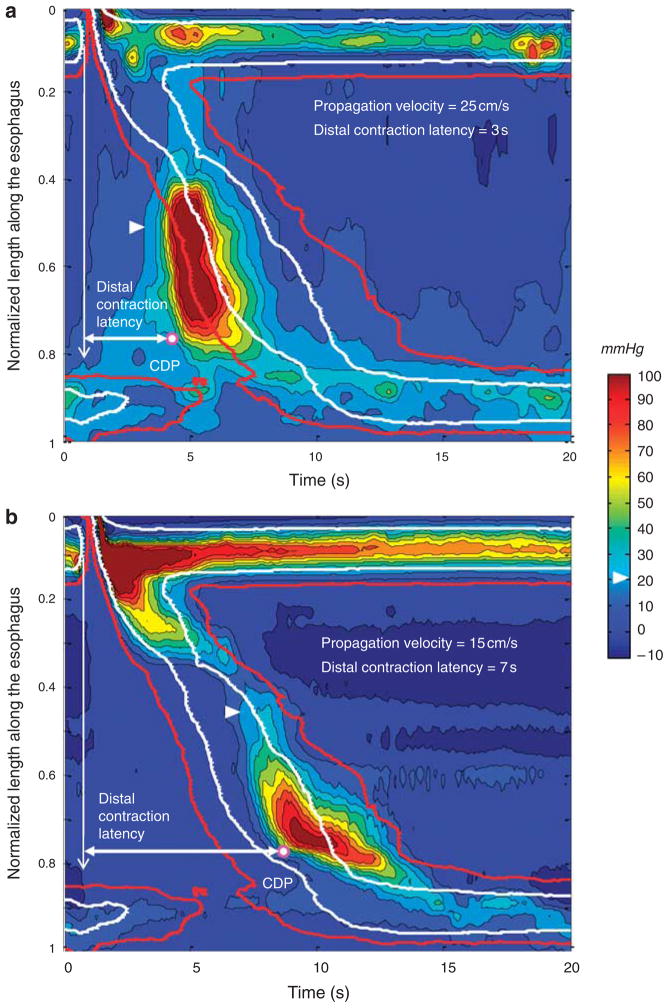
The advantage of gauging peristaltic propagation by the latency of the contraction as opposed to propagation velocity is further illustrated by the examples in Figure 6. Both panels in the figure illustrate EPT plots with rapid propagation, be it measured in conventional or EPT terms. However, only the patient with symptoms of esophageal spasm (upper panel) had short latency of the distal contraction.
Figure 6.
Examples of composite swallows in two subjects with rapid propagation velocity. The arrowhead delineates the 20 mm Hg isobaric contour. White and red isobaric contours correspond to the median and the 95th percentile for the 20 mm Hg isobaric contour of the 75-control subject composite swallow, respectively. The contractile deceleration point (CDP) is marked by the white dot. The vertical arrow indicates the onset of upper esophageal sphincter (UES) relaxation and the horizontal arrow the distal contraction latency. (a) The 8-swallow composite of a 79-year-old man with heartburn and dysphagia. The lower esophageal sphincter (LES) relaxation is normal (mean integrated relaxation pressure (IRP) = 8.8 mm Hg). The distal contraction latency is clearly short as evident by its preceding the overlaid red isobaric contour. This pattern is consistent with a diffuse esophageal spasm. (b) The 8-swallow composite of a 21-year-old female control subject without any esophageal symptoms. The LES relaxation is normal (mean IRP = 11.3 mm Hg). Despite rapid propagation velocity, the latency of the distal contraction is normal.
DISCUSSION
Esophageal motility disorders can potentially affect either the timing or magnitude of contraction at a given location along the esophagus. It follows that a comprehensive analysis of esophageal motility should consider both variables, contractility, and the timing of contraction. In the conventional classification of motility disorders, propagation velocity is used as an indication of the timing of contraction. However, with the advent of EPT, it became apparent that this can be a rather subjective measure because of normal variability in propagation velocity along the length of the esophagus. An alternative gauge of contractile propagation is the latency of the contraction relative to the swallow. The major aim of this study was to develop a scheme by which the latency of the distal esophageal contraction can be measured on EPT plots as an alternative to the measurement of the propagation velocity. This was achieved using data from 75 control subjects and normalizing it both in time and relative length along the esophagus to extract stereotypic pressure topography landmarks of peristalsis. The advantage of normalizing esophageal length is that it negates variability in length among subjects and instead localizes contractions in relation to the segmental architecture peristalsis. The advantage of averaging swallows within and among subjects is to cancel out pressure signals not synchronized with swallowing, notably those due to respiration and heartbeat. The major findings of this study were: (i) pressure topography of peristalsis was remarkably stereotyped among subjects terminating at the CDP at, on average, 70% of the distance between the distal pharynx and proximal stomach, and (ii) the median latency to contraction at the CDP was 6.0 s with a 95 % confidence interval of 4.8–7.6 s. Normal values were also established for the latency of LES contraction (9.2 s, 95% confidence interval 6.5–11.5 s) and for the pressure peaks and contractile magnitude of the distal esophageal contraction (Table 2).
The clinical implication of quantifying the distal contraction latency is in identifying conditions characterized by short latency rather than by an abnormal conduction velocity. The potential advantage of this is shown in Figure 6 wherein rapid conduction velocity is shown in both a normal and abnormal EPT study. Short latency of the distal contraction, on the other hand, was not found in any of the 75 subjects and the shortest mean latency observed was 4.9 s. We hypothesize that conditions characterized by short latency of the distal contraction are indicative of impaired or absent inhibitory gangionic neuronal function. In association with impaired LES relaxation, this constitutes spastic achalasia (15). Consistent with this hypothesis, the histological characterization of achalasia is of myenteric plexus inflammation of destruction (4,5). In the absence of LES involvement, short latency of the distal contraction would constitute DES (Figure 6, top panel). The issue of DES is of particular interest because, when defined in conventional terms, it is a heterogeneous entity, associated with several distinct contractile abnormalities. The most widely utilized criterion for identifying DES in conventional manometry is of simultaneous contractions, generally defined as being propagated more rapidly than 8 cm/s (16,17). However, the data in Figure 5 and the normal subject example in the bottom panel of Figure 6 illustrate the limitations of using that criterion in EPT studies. Wide regional variations in propagation velocity are normal, a by-product of the segmental characteristic of the peristaltic contraction. Consequently, defining DES based on the occurrence of a distal esophageal contraction within short latency (within the 4.8-s window after UES relaxation) may better isolate a homogeneous disorder of uniform pathophysiology. Further refinement of the limits of the distal contraction latency may be possible with pharmacologic manipulation and/or testing repetitive swallows.
It is important to recognize that although a complex scheme of secondary processing of EPT data was used to derive the data presented in this analysis, the results should be broadly applicable without need for an analogous process. Individual clinical EPT studies can be compared with the data sets presented in the figures and tables utilizing the stated confidence intervals. Illustrative of this, the ranges for the IRP and DCI from the 75-subject composite swallow are very similar to values derived in a more conventional manner. The key concept added to existing analysis paradigms, which is somewhat natural given the format of pressure topography plots, is to incorporate the temporal coordinates with which contractions occur into the analysis. Calculation of a composite swallow by superimposing individual synchronized swallow sequences is an adaptation of a common physiological technique that could easily be incorporated into EPT analysis software and may also be helpful to simplify the diagnosis of esophageal motility disorders in clinical practice.
In summary, this study utilized a normative data set of 75 HRM studies to extract the stereotypic features of peristalsis in EPT. Composite data among subjects were computed with reference to the segmental architecture of peristalsis. The resultant proposed scheme of analysis uses not only the magnitude of contraction, but also the location-specific temporal coordinates of the contraction. The potential advantage of the approach is in facilitating the analysis of peristaltic abnormalities by operant physiological mechanism, which should help rationalize subsequent treatment strategy. Future studies will test the utility of this analytic scheme in differentiating disorders attributable to short latency (spastic achalasia, DES) from aberrant contractility.
Study Highlights.
WHAT IS CURRENT KNOWLEDGE
A defining feature of peristalsis is propagation velocity that is mediated by progressively prolonged neural inhibition in the distal esophagus and lower esophageal sphincter (LES).
Esophageal pressure topography (EPT) is a format for displaying high-resolution manometry data that capture both the timing and relative position of esophageal contractions as a continuum.
WHAT IS NEW HERE
An algorithm was developed to merge manometric data among subjects and extract the stereotypical features of peristalsis in a coordinate-based (normalized esophageal length, timing) analysis.
Distal contraction latency was quantified from the time of the swallow to the termination of peristalsis in the distal esophagus on EPT plots; its median duration was 6.0 s in the distal esophagus and 9.2 s in the LES.
Quantifying the latency of the distal contraction relative to the swallow as an alternative to conventional measures of propagation velocity lays the foundation for a physiologically grounded classification of motility disorders in EPT.
Acknowledgments
Financial support: This work was supported by R01 DK56033 (P.J.K.) and R01 DK079902 (J.E.P.) from the Public Health Service.
Footnotes
Guarantor of the article: Peter J. Kahrilas, MD.
Specific author contributions: Sabine Roman: analysis and interpretation of data, drafting of the manuscript, and approval of the final version. Zhiyue Lin: analysis and interpretation of data, revising the manuscript critically, and approval of the final version. John E. Pandolfino: study concept and design, analysis and interpretation of data, drafting of the manuscript, and approval of the final version. Peter J. Kahrilas: study concept and design, analysis and interpretation of data, drafting of the manuscript, and approval of the final version.
CONFLICT OF INTEREST
Potential competing interests: None.
References
- 1.Crist J, Gidda JS, Goyal RK. Intramural mechanism of esophageal peristalsis: roles of cholinergic and noncholinergic nerves. Proc Natl Acad Sci USA. 1984;81:3595–9. doi: 10.1073/pnas.81.11.3595. [DOI] [PMC free article] [PubMed] [Google Scholar]
- 2.Crist J, Gidda JS, Goyal RK. Characteristics of “on” and “off ” contractions in esophageal circular muscle in vitro. Am J Physiol. 1984;246:G137–44. doi: 10.1152/ajpgi.1984.246.2.G137. [DOI] [PubMed] [Google Scholar]
- 3.Goyal RK, Chaudhury A. Physiology of normal esophageal motility. J Clin Gastroenterol. 2008;42:610–9. doi: 10.1097/MCG.0b013e31816b444d. [DOI] [PMC free article] [PubMed] [Google Scholar]
- 4.Gockel I, Bohl JR, Eckardt VF, et al. Reduction of interstitial cells of Cajal (ICC) associated with neuronal nitric oxide synthase (n-NOS) in patients with achalasia. Am J Gastroenterol. 2008;103:856–64. doi: 10.1111/j.1572-0241.2007.01667.x. [DOI] [PubMed] [Google Scholar]
- 5.Raymond L, Lach B, Shamji FM. Inflammatory aetiology of primary oesophageal achalasia: an immunohistochemical and ultrastructural study of Auerbach’s plexus. Histopathology. 1999;35:445–53. doi: 10.1046/j.1365-2559.1999.035005445.x. [DOI] [PubMed] [Google Scholar]
- 6.Sifrim D, Janssens J, Vantrappen G. Failing deglutitive inhibition in primary esophageal motility disorders. Gastroenterology. 1994;106:875–82. doi: 10.1016/0016-5085(94)90745-5. [DOI] [PubMed] [Google Scholar]
- 7.Behar J, Biancani P. Pathogenesis of simultaneous esophageal contractions in patients with motility disorders. Gastroenterology. 1993;105:111–8. doi: 10.1016/0016-5085(93)90016-6. [DOI] [PubMed] [Google Scholar]
- 8.Kahrilas PJ, Sifrim D. High-resolution manometry and impedance-pH/manometry: valuable tools in clinical and investigational esophagology. Gastroenterology. 2008;135:756–69. doi: 10.1053/j.gastro.2008.05.048. [DOI] [PMC free article] [PubMed] [Google Scholar]
- 9.Bulsiewicz WJ, Kahrilas PJ, Kwiatek MA, et al. Esophageal pressure topography criteria indicative of incomplete bolus clearance: a study using high-resolution impedance manometry. Am J Gastroenterol. 2009;104:2721–8. doi: 10.1038/ajg.2009.467. [DOI] [PMC free article] [PubMed] [Google Scholar]
- 10.Ghosh SK, Kahrilas PJ, Lodhia N, et al. Utilizing intraluminal pressure differences to predict esophageal bolus flow dynamics. Am J Physiol Gastrointest Liver Physiol. 2007;293:G1023–8. doi: 10.1152/ajpgi.00384.2007. [DOI] [PubMed] [Google Scholar]
- 11.Pandolfino JE, Leslie E, Luger D, et al. The contractile deceleration point: an important physiologic landmark on oesophageal pressure topography. Neurogastroenterol Motil. 2010;22:395–400. doi: 10.1111/j.1365-2982.2009.01443.x. [DOI] [PMC free article] [PubMed] [Google Scholar]
- 12.Ghosh SK, Pandolfino JE, Rice J, et al. Impaired deglutitive EGJ relaxation in clinical esophageal manometry: a quantitative analysis of 400 patients and 75 controls. Am J Physiol Gastrointest Liver Physiol. 2007;293:G878–85. doi: 10.1152/ajpgi.00252.2007. [DOI] [PubMed] [Google Scholar]
- 13.Pandolfino JE, Ghosh SK, Rice J, et al. Classifying esophageal motility by pressure topography characteristics: a study of 400 patients and 75 controls. Am J Gastroenterol. 2008;103:27–37. doi: 10.1111/j.1572-0241.2007.01532.x. [DOI] [PubMed] [Google Scholar]
- 14.Kahrilas PJ, Dodds WJ, Hogan WJ. Effect of peristaltic dysfunction on esophageal volume clearance. Gastroenterology. 1988;94:73–80. doi: 10.1016/0016-5085(88)90612-9. [DOI] [PubMed] [Google Scholar]
- 15.Pandolfino JE, Kwiatek MA, Nealis T, et al. Achalasia: a new clinically relevant classification by high-resolution manometry. Gastroenterology. 2008;135:1526–33. doi: 10.1053/j.gastro.2008.07.022. [DOI] [PMC free article] [PubMed] [Google Scholar]
- 16.Richter JE, Castell DO. Diffuse esophageal spasm: a reappraisal. Ann Intern Med. 1984;100:242–5. doi: 10.7326/0003-4819-100-2-242. [DOI] [PubMed] [Google Scholar]
- 17.Richter JE, Wu WC, Johns DN, et al. Esophageal manometry in 95 healthy adult volunteers. Variability of pressures with age and frequency of “abnormal” contractions. Dig Dis Sci. 1987;32:583–92. doi: 10.1007/BF01296157. [DOI] [PubMed] [Google Scholar]


