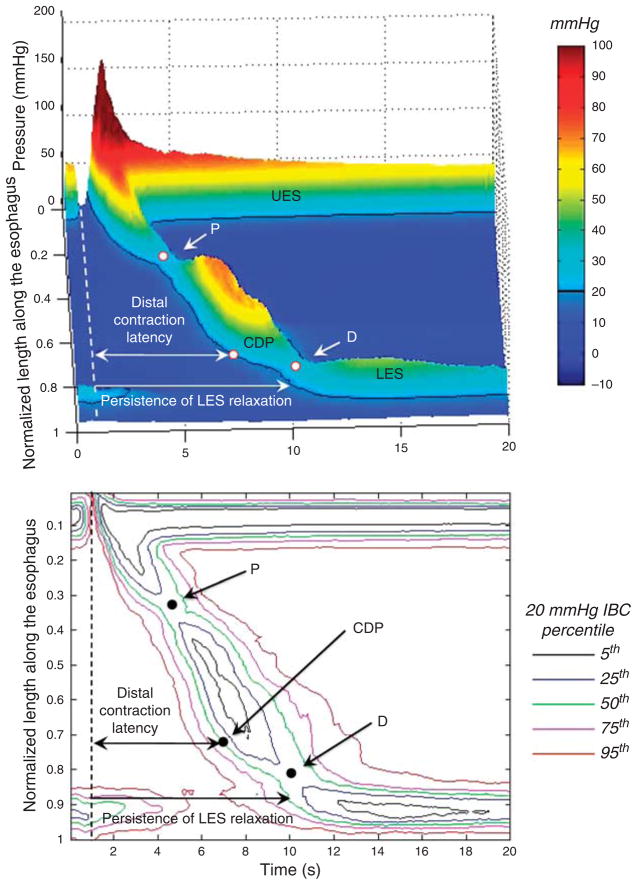
Figure 4.
Landscape plot of the 50th percentile of 75-subject composite pressure topography is shown in the upper panel. The dashed line represents the time upper esophageal sphincter (UES) relaxation. Proximal trough (P), contractile deceleration point (CDP), and distal trough (D) are identified in all the subjects. The distal contraction latency is measured from the onset of upper esophageal sphincter relaxation to the CDP. The persistence of lower esophageal sphincter (LES) relaxation is also indicated from the UES relaxation to LES contraction to 20 mm Hg. The corresponding pressure topography of the 5th, 25th, 50th, 75th, and 95th percentiles for the 20 mm Hg isobaric contour are illustrated in the lower panel.

