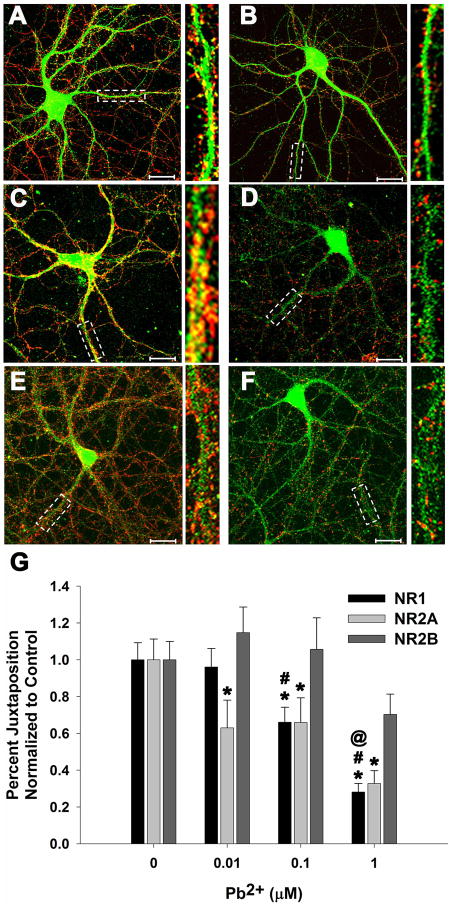
Figure 1. Pb2+ exposure decreases the juxtaposition of NR1 and NR2A with synaptophysin (Syn)-containing presynaptic active zones.
Representative images of control (A, C, E) and 1 μM Pb2+-treated (B, D, F) neurons stained for NR1 (A, B), NR2A (C, D), and NR2B (E, F) in green and Syn in red. Juxtaposition is visualized as yellow or orange color. Highlighted regions for each cell are shown magnified to the right. (G) Quantification of the juxtaposition of NR1, NR2A, and NR2B with Syn. A concentration-dependent decrease in juxtaposition of NR1 and NR2A is observed after exposure to Pb2+ but NR2B juxtaposition with Syn does not change significantly. Data are mean ± SEM and are the result of 3 independent trials with 16–18 neurons per condition. Scale bar = 20 μm, * = significance from control, # = significance from 0.01 μM Pb2+, and @ = significance from 0.1 μM Pb2+ (Fisher’s Protected LSD).

