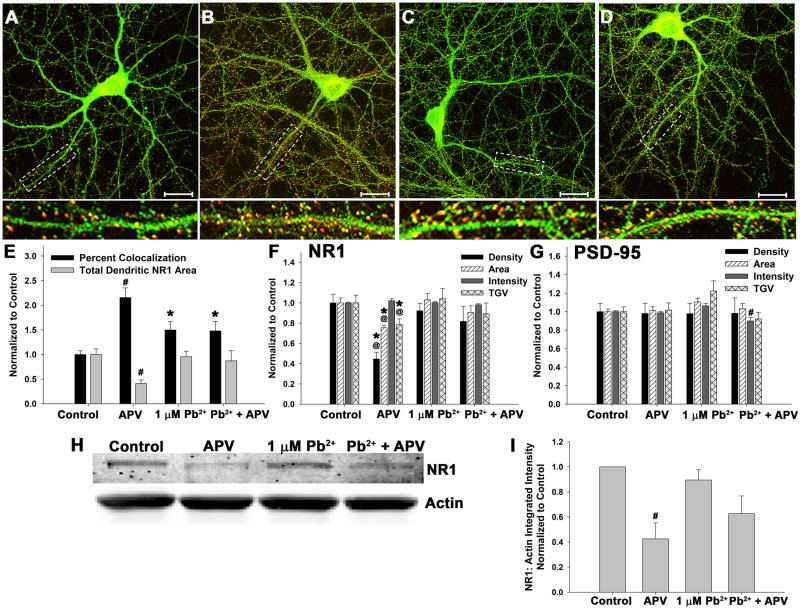
Figure 6. NMDAR inhibition results in increased NR1 targeting to the PSD.
Neurons were exposed to 100 μM APV, 1 μM Pb2+, or both from DIV7 - DIV12
(A-D) Representative images of control (A), 100 μM APV (B), 1 μM Pb2+ (C), and Pb2+ + APV (D)-treated neurons stained for NR1 (green) and PSD-95 (red). Colocalization is shown as yellow or orange color. Scale bar= 20 μm.
(E) Quantification of colocalization of NR1 and PSD-95. Both Pb2+ and APV treatments increase colocalization but APV treatment does so to a higher magnitude. The colocalization calculation is: . APV significantly reduces total NR1 dendritic area, resulting in increased percent colocalization. Data are the result of 3 independent trials with 12–14 neurons per treatment.
(F) NR1 immunofluorescent parameters. APV exposure significantly reduces NR1 puncta parameters, but Pb2+ or Pb2+ + APV treatments do not. Data are the result of 3 independent trials with 14–15 neurons per treatment.
(G) PSD-95 immunfluorescent parameters. No changes in spine density, area, or intensity are observed after any treatment, but neurons treated with APV + Pb2+ exhibited a decrease in PSD-95 puncta intensity. Data are the result of 3 independent trials with 14–15 neurons per treatment.
(H-I) Representative immunoblot of whole cell protein probed for NR1 and Actin (H). Quantification in (I). APV significantly reduces NR1 levels, but Pb2+ and co-exposure treatments do not, although they both exhibit non-significant reductions in NR1 protein. Data are the result of 3 independent trials.
Data are represented as the mean ± SEM. * = significance from control, @ = significance from 1.0 μM Pb2+, and # = significance from all other conditions (Fisher’s Protected LSD).

