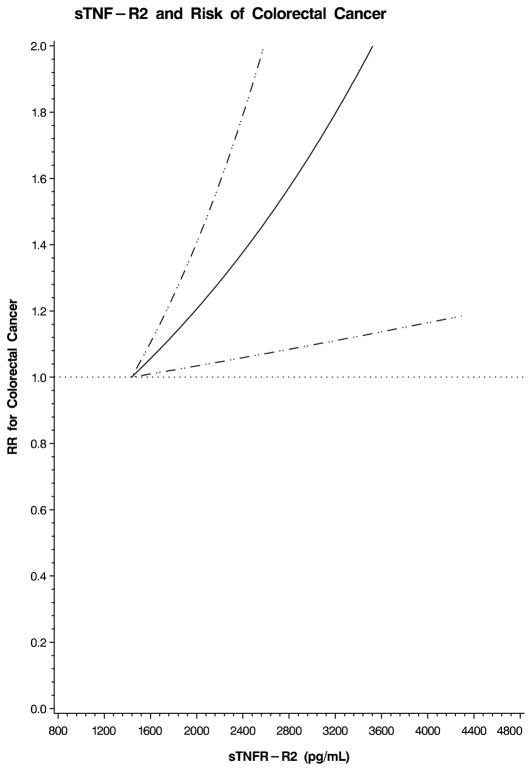
Figure 1.
Restricted cubic spline plot for sTNF-R2 and risk of colorectal cancer. Relative risk (RR) of colorectal cancer is plotted according to plasma sTNF-R2 (pg/mL). Hatched lines represent 95% confidence intervals (CI). Spline was adjusted for the same factors as the multivariate model in Table 3. A test for overall significance of the curve was statistically significant (p=0.02).

