
Figure 7. Experimental validation of 33 TFs.
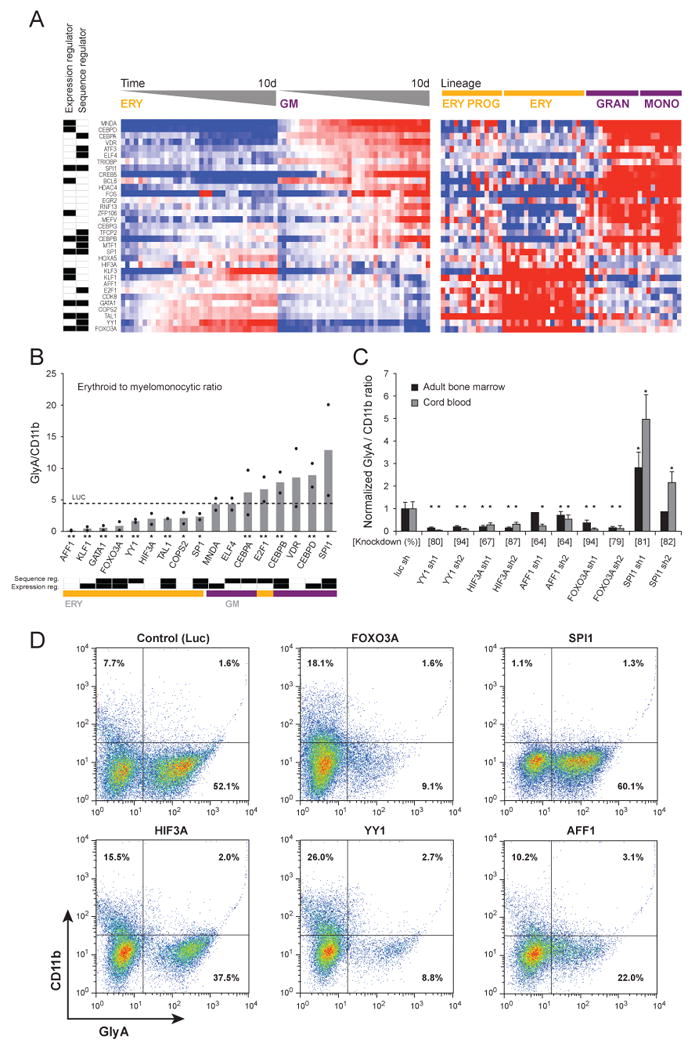
(A) The expression of 33 TFs was detected in primary human bone marrow CD34+ progenitor cells undergoing differentiation in vitro, harvested at 12 time points between days 3 to 10 of differentiation, and detected by a multiplexed assay using LMA followed by fluorescent bead-based detection (left heat map). In the heat map in the right panel, the expression of the same TFs in the original Affymetrix dataset is illustrated. The labels at the far left indicate whether the TF was chosen as a regulator in the expression-based model or in the sequence-based model. (B) Differentiation following TF silencing with shRNA. Human bone marrow CD34+ cells expressing shRNAs targeting TFs were induced to differentiate in-vitro for 10 days, and the ratio of erythroid (glycophorin A positive) and myelomonocytic (CD11b positive) cells was measured by flow cytometry. Each black dot represents an individual shRNA (mean of three replicates), and bars indicate their average. The effect of a control shRNA targeting the luciferase gene, which is not expressed in human cells, is indicated with a dashed line. Below the shRNA labels, * or ** indicates p < .05 for one or both shRNAs, respectively. Bottom – classification of the TFs according to their roles in the expression-based and sequence-based models, and to their induction pattern in the LMA profiling. (C) The effects of additional shRNAs targeting candidate TFs expressed in CD34+ cells derived from both umbilical cord blood and adult bone marrow and assayed as in panel B (* indicates p < .01). (D) Representative flow cytometry scatter plots from shRNAs expressed in umbilical cord blood. See additional information in Tables S5, S6 and S7.