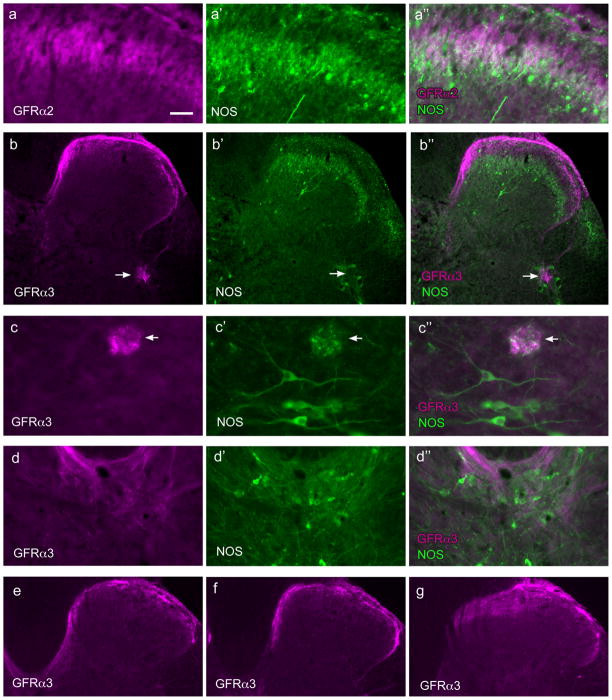
Figure 4.
Distribution of GFRα2- and GFRα3-immunoreactive fibers in the sacral spinal cord. Each of the top four horizontal sets of three micrographs shows immunoreactivity (IR) for a GFR (a–d), nitric oxide synthase (NOS, a’–d’), and a merged image (a’’–d’’). Images are oriented with dorsal surface at the top (all images) and medial cord on the left (a–c,e); d is located in the midline, dorsal to the central canal. a, GFRα2-IR fibers co-located in a similar region of lamina II as NOS-IR fibers. b, GFRα3-IR fibers in the dorsal horn extend in a medial band almost to the midline where they branched off into the dorsal gray commissure, while laterally some GFRα3-IR fibers were found in the lateral-collateral pathway, terminating in a small region within the more dorsal preganglionic neurons (arrow). c shows example of a small patch of GFRα3-IR fibers (arrows) lying dorsal to the region containing preganglionic neurons; this region also contains some NOS-IR fibers. d, dorsal gray commissure contains some GFRα3-IR fibers, especially in the most dorsal region. Panels e, f and g show progressive changes in the distribution of GFRα3-IR fibers moving more rostrally in the spinal cord; e shows caudal L6 where the medially located fibers travelling towards the midline; f shows rostral L6 where these fibers extend less medially and g shows L5 where there are no medially projecting GFRα3-IR fibers; note that in L5 GFRα3-IR fibers extend well into lamina II of the medial dorsal horn. Calibration bar represents 20 μm (c), 30 μm (a), 60 μm (d) or 100 μm (b, e–g).

