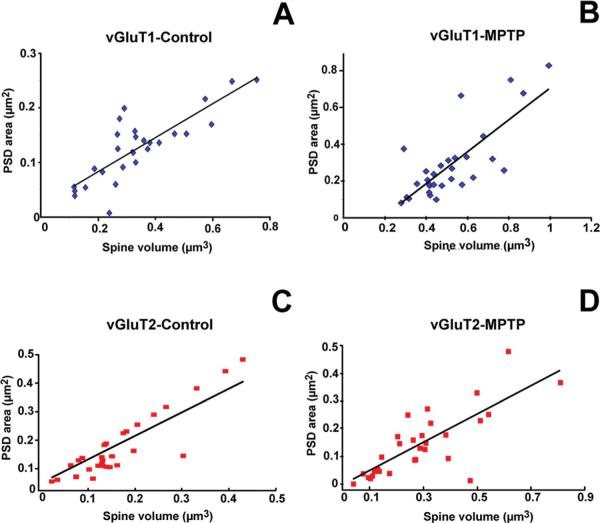
Figure 2.
Scatter diagrams showing the correlation between spine volume (μm3) and the surface (μm2) of postsynaptic densities (PSDs) at corticostriatal (vGluT1) and thalamostriatal (vGluT2) excitatory synapses in the postcommissural putamen of normal (n = 3) versus MPTP-treated (n = 3) monkeys. In all cases, the area of the PSDs was positively correlated with the spine volume. A,B: Correlation of PSD areas and spine volume in spines that receive vGluT1-containing cortical afferents in control (A; coefficient of correlation, R = 0.815) and MPTP-treated animals (B; R = 0.777). C,D: PSD areas plotted as a function of spine volume in striatal spines receiving vGluT2-containing thalamic inputs in normal (C) and parkinsonian monkeys (D). For the correlation between vGluT2-IR terminals and their contacting spines, the value of R was 0.699 for controls and 0.784 for MPTP-treated animals (P < 0.0001; the number of spines studied in each group was n = 30 for A–D). [Color figure can be viewed in the online issue, which is available at wileyonlinelibrary.com.]

