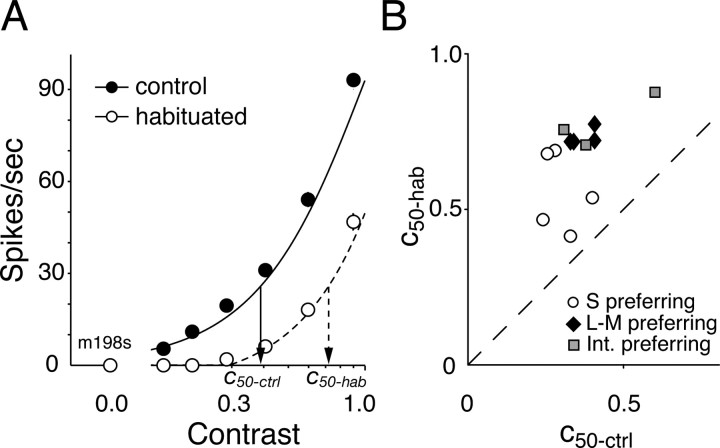
Figure 2.
A, Contrast–response functions from a representative cell, measured during control conditions (filled symbols) and during habituation (open symbols) to unit contrast modulation. The probe and the habituating stimulus were modulated in the preferred color direction (45°). In this and all subsequent figures, the vertical bars show ±1 SEM. Responses were fit with the model described in Materials and Methods. The arrows identify contrasts in the control (c50-ctrl) and habituated (c50-hab) states that evoke one-half of the maximum response in the habituated state. B, Impact of habituation on contrast sensitivity of cells of different types: c50-ctrl is plotted against c50-hab. We take the ratio of these contrasts as a measure of the change in contrast sensitivity.

