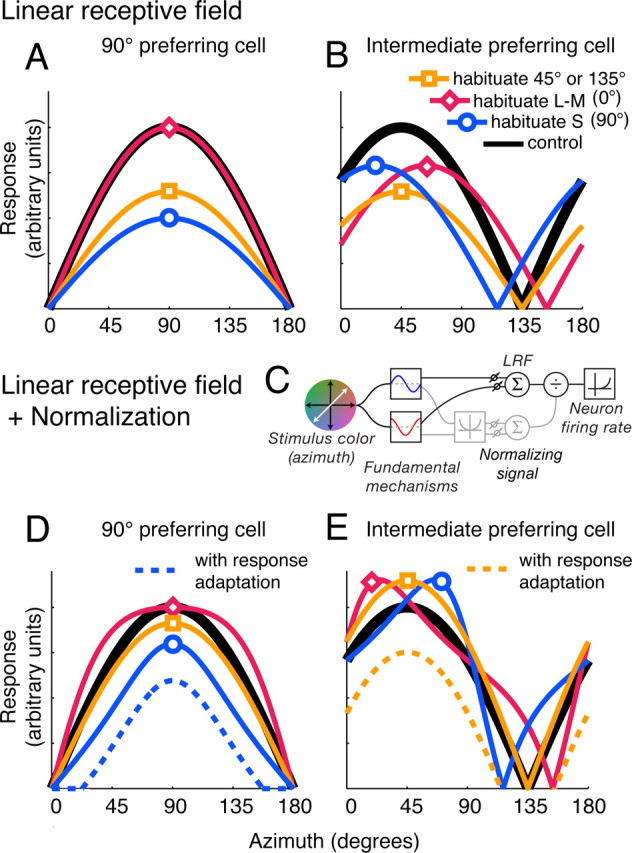
Figure 3.

The effect of habituation on model V1 neurons. Each panel shows how the response of a different model neuron varied with direction of modulation in the control condition (black curve), and during habituation along S (blue curve), L–M (magenta curve), or an intermediate color direction (45 or 135°; orange curve). In this and similar figures, the sign of the response (increase or decrease in discharge) is ignored, and all responses are plotted as positive values. A, B, Model incorporating linear receptive field only. The neuron in A receives input only from the S mechanism; the neuron in B sums inputs from both the L–M and S mechanisms. C, Diagram showing the components of the model outlined in the text. The stimulus is filtered separately through the two fundamental mechanisms: the sum of their weighted linear outputs drives the LRF; the sum of their squared weighted outputs drives a chromatic gain control (normalizing signal) that acts divisively on the response of the LRF. The resulting signal is then transformed into firing rate via an instantaneous nonlinear function. D, E, Model neurons incorporating linear receptive field and normalization (see Materials and Methods). D, S-preferring cell with normalization from both the L–M and the S mechanisms. E, Intermediate-preferring cell with normalization from both the L–M and the S mechanisms. The dashed curves show the additional effect of response adaptation, demonstrated for habituation to the preferred direction. Other conventions are as in A and B.
