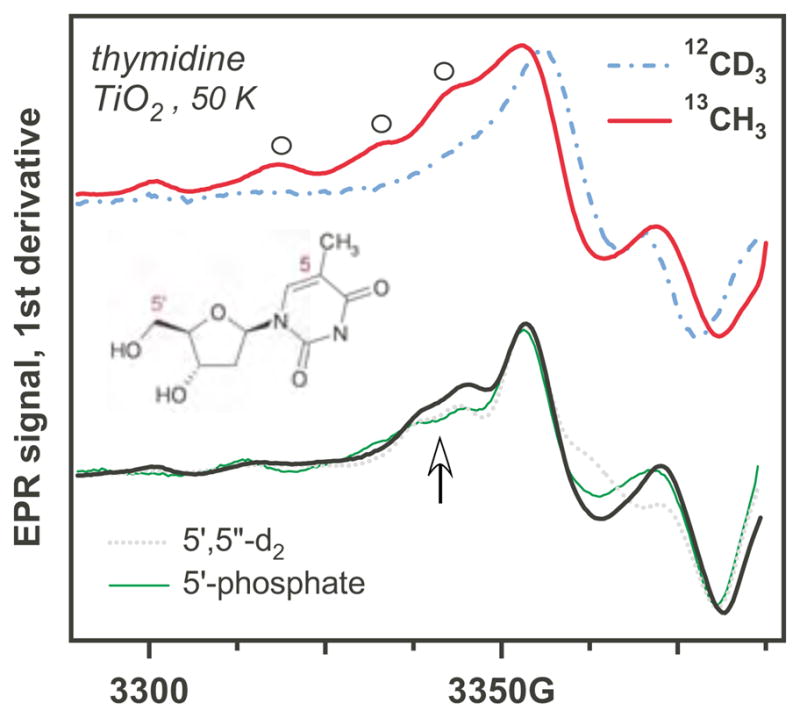
Figure 6.

EPR spectra for photooxidation of thymine derivatives on aqueous TiO2. The upper traces are for the methyl isotopomers (Schemes 1 and 4). The bold lines are for the 2′-deoxy-β-thymidine, the dash-dot lines are for the thymine, other derivatives are indicated in the plot. Open circles indicate the resonance lines also indicated in Figure 9S.
