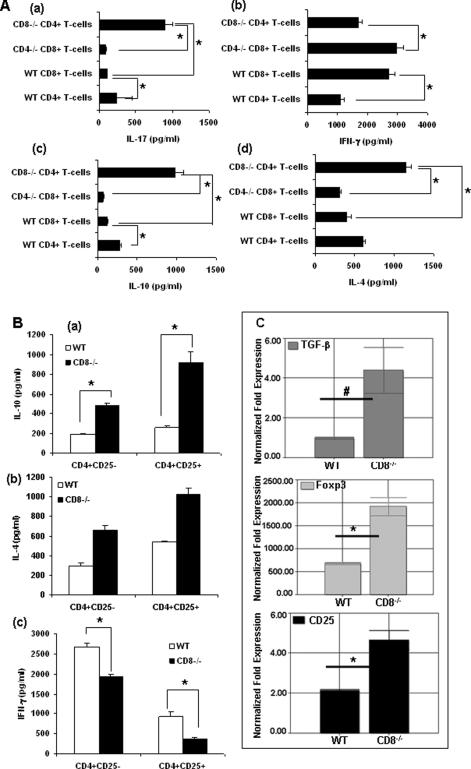
Figure 5.
(A) Cytokine profiles of T-cells isolated from draining lymph nodes of CD4−/−, CD8−/−, and WT mice after 40 wk of UVB induced cutaneous carcinogenesis. Cytokine levels were measured in supernatants by ELISA after 48h of CD3 capture. (*p < 0.05). There were three mice per group and results are expressed as mean ± SD. (B) Production of IL-10, IL-4 and IFN-γ from regulatory T-cells (Tregs) and T-effector cells from CD8−/−, and WT mice after 40 wk of UVB induced cutaneous carcinogenesis. Effector (CD4+CD25−) and regulatory T-cells (CD4+CD25+) purified from draining lymph nodes of the mice were then stimulated with anti-CD3 antibody. IL-10, IL-4 and IFN-γ were measured in supernatants by ELISA. (C) Expression of immunosuppressive TGF-β, CD25 and Foxp3 in regulatory T-cells from CD8−/− and WT mice by Real-time PCR.

