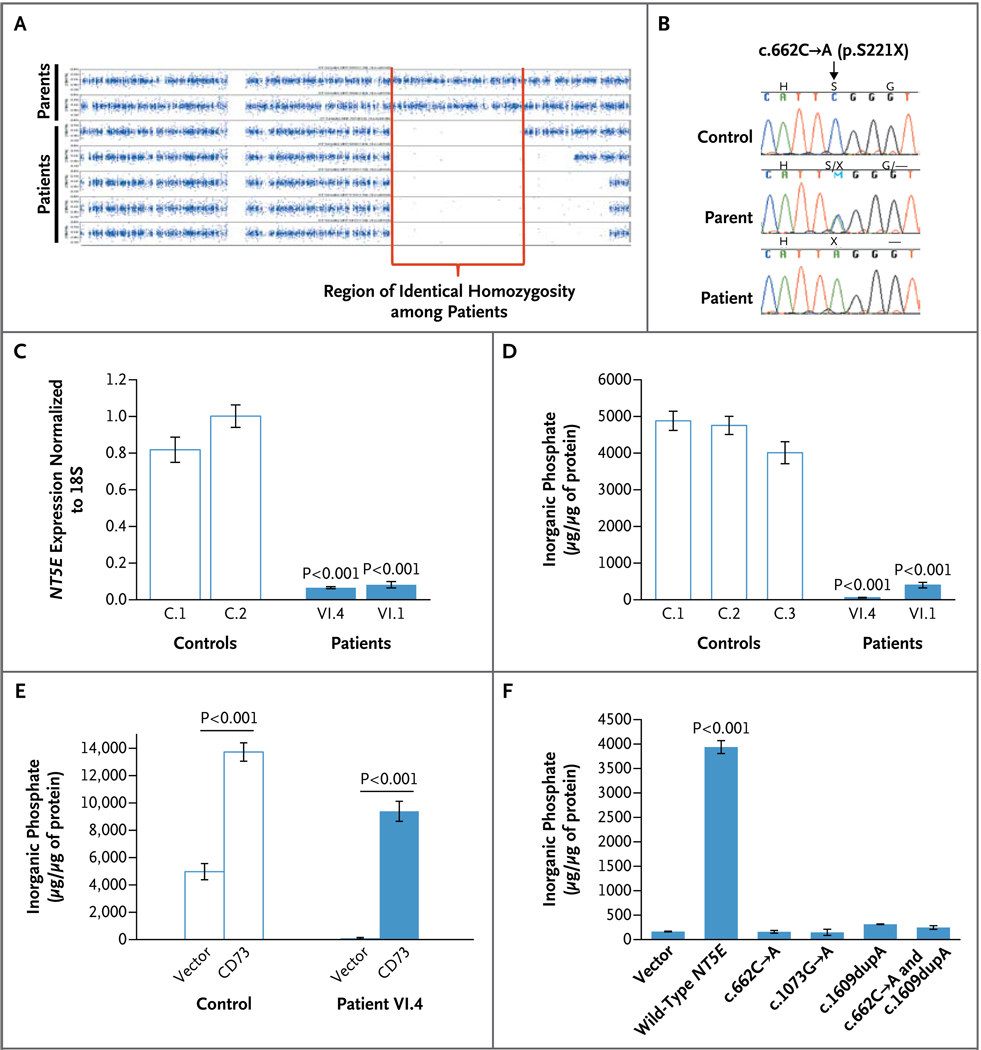
Figure 2. Results of Genetic and Enzyme Studies in Family 1.
Panel A shows single-nucleotide polymorphism (SNP)–array homozygosity plots for the five affected siblings in Family 1 and their parents. The five affected siblings shared a region in which heterozygosity was absent, reflecting identity by means of descent in this consanguineous family. Panel B shows sequence chromatograms for a control, a parent of an affected member of Family 1, and an affected member; the nonsense mutation (p.S221X) is indicated. Panel C shows NT5E messenger RNA (complementary DNA [cDNA]) expression in Patients VI.4 and VI.1 as compared with controls. Panel D shows a deficiency in CD73 enzyme activity (represented by AMP-dependent inorganic phosphate production) in cultured fibroblasts from Patient VI.4 and Patient VI.1 of Family 1. Panel E shows CD73 enzyme activity in fibroblasts from controls and from Patient VI.4 after the fibroblasts were transduced with either an empty vector (containing green fluorescent protein only) or a CD73-containing vector. The CD73 vector increased CD73 activity (represented by AMP-dependent inorganic phosphate production) in both the control cells and the patients’ cells. Panel F shows CD73 activity (represented by AMP-dependent inorganic phosphate production) in HEK293 cells transfected with an empty vector or a vector containing wild-type NT5E or NT5E with the c.622C→A, c.1073G→A, or c.1609dupA mutation or both the c.622C→A and c.1609dupA mutations (in a 1:1 ratio, simulating the state in Patient II.1 of Family 3). In Panels C, D, and F, data are the means of three experiments and were analyzed with the use of one-way analysis of variance with Dunnett’s multiple-comparison post hoc test. In Panel E, data are the means of three experiments and were analyzed with the use of an unpaired Student’s t-test. P values are shown for the comparison with controls in Panels C and D and with the various mutated cDNA in Panel F. In Panels C through F, I bars indicate the standard deviations.

