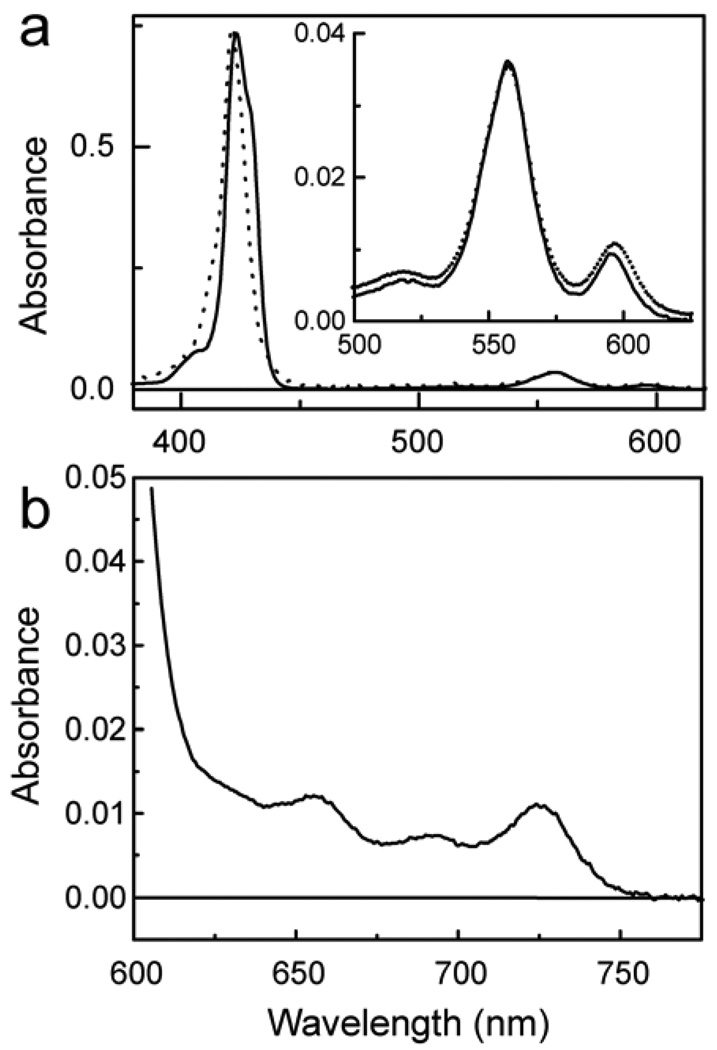
Figure 3.
(a) Absorption spectra in 2-methyltetrahydrofuran of triad 1 (dotted) and model porphyrin dyad 6 (solid). The inset shows the Q-band region at a higher concentration. (b) Absorption spectrum in 2-methyltetrahydrofuran of triad 1 showing the long-wavelength fullerene absorption bands. These establish the trans-2 substitution pattern,29 which is also consistent with the nmr results.

