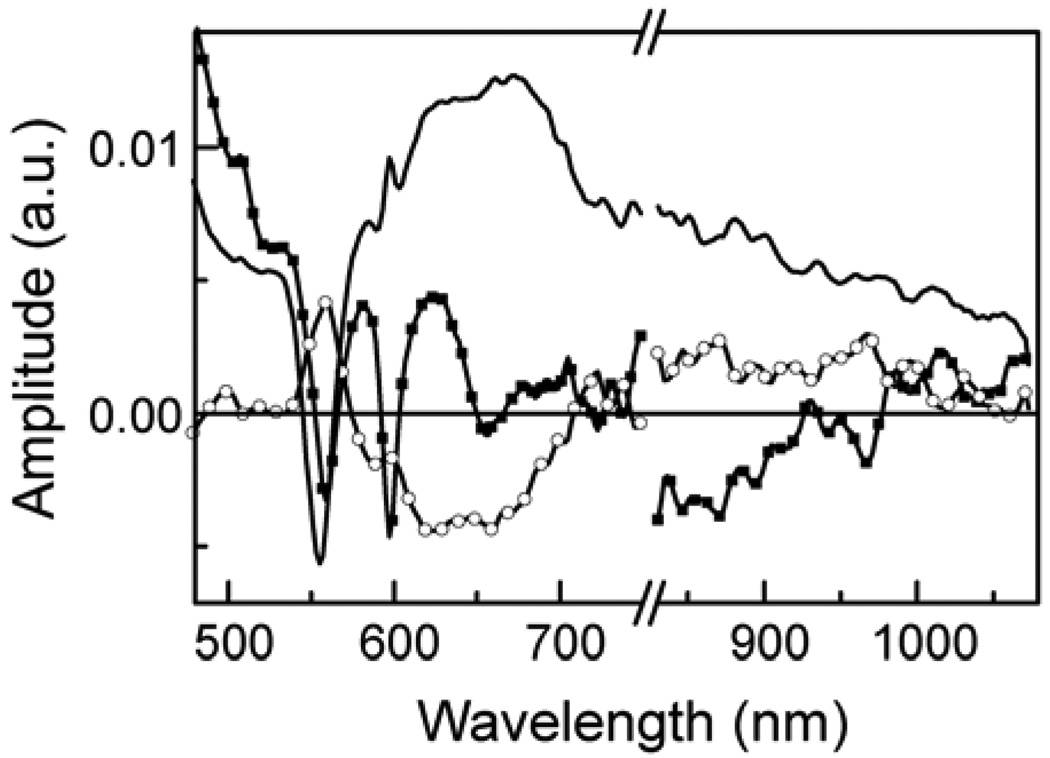
Figure 9.
Transient absorption decay associated spectra of triad 1 in 2-methyltetrahydrofuran with excitation at 600 nm. The data were fitted as three exponentials with time constants of 1.1 ps (squares), 7.8 ps (fixed in the analysis, circles) and 2.7 ns (solid line). Data were taken over two wavelength regions, as indicated by the break in the horizontal axis. The vertical axis represents the relative amplitude of the transient absorption signal associated with the relevant time constant.

