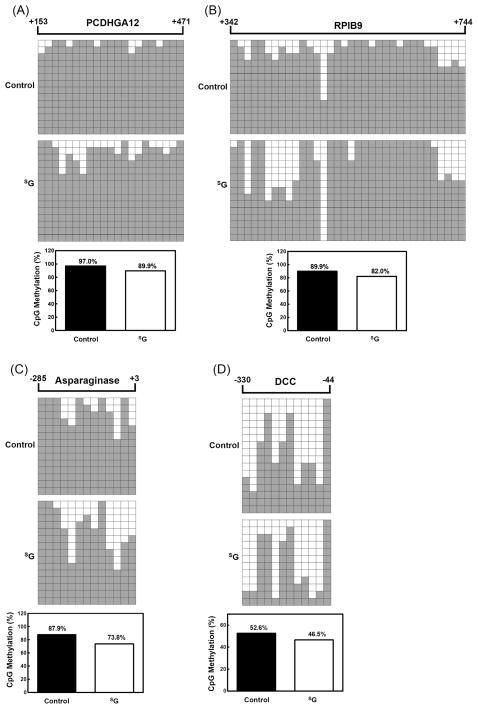
Figure 2. Bisulfite genomic sequencing shows that SG treatment leads to decreased methylation at CpG sites in the predicted promoter region and/or the first exon of genes.
(A) PCDHGA12; (B) RPIB9; (C) Asparaginase; (D) DCC. Each square represents a single CpG site. The number of rows designates the number of the colonies sequenced. White and black squares represent unmethylated and methylated CpGs, respectively. The percentage of CpG methylation is listed underneath each figure.

