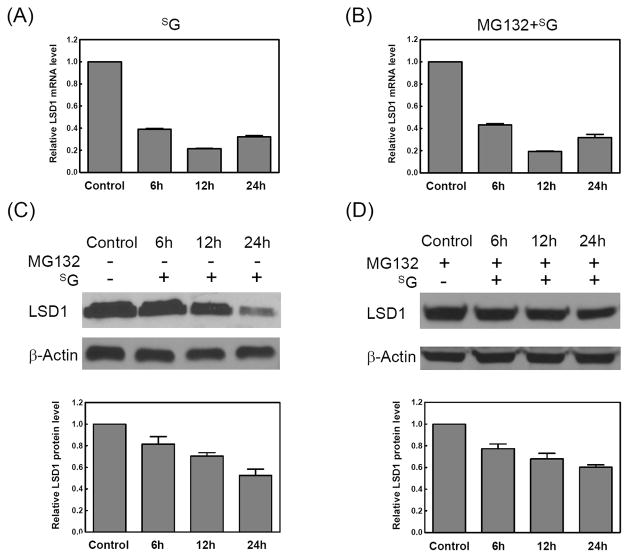
Figure 4. LSD1 was degraded upon SG treatment.
(A) Real-time RT-PCR analysis of the expression of LSD1 mRNA in cells treated with SG for various time periods. (B) Real-time RT-PCR analysis of the expression of LSD1 mRNA in cells pretreated with MG132 (25 μM) for 2 h and then treated with SG (3 μM) for various time periods. The results represent the means and standard deviations of data from three independent experiments. (C) Western blot analysis of LSD1 with whole-cell extracts from Jurkat-T cells treated with SG (3 μM) for various time periods. (D) Western blot analysis of LSD1 with whole-cell extracts from Jurkat-T cells pretreated with MG132 (25 μM) for 2 h and then treated with SG for various time periods. The histograms shown under (C) and (D) are the LSD1 fold changes, which were obtained by normalizing the band intensity of LSD1 to that of the loading control, β-actin. The results represent the means and standard deviations of data from three independent drug treatment and Western blot experiments.

