
Figure 4. ATP upregulates TGFα expression at 3 distinct levels of the OE via activation of purinergic receptors.
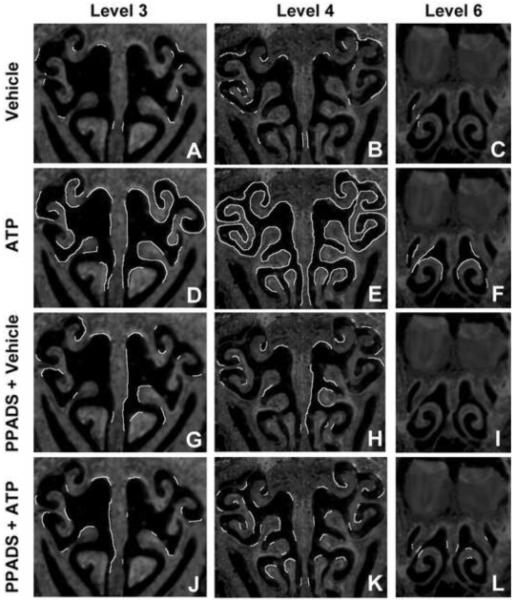
Mice were treated with vehicle (A-C) ATP (D-F) PPADS (G-I) and ATP + PPADS (J-L). TGFα-IR was assessed 48 hr post-instillation at levels 3, 4 and 6 in the nasal cavity defined by the presence of specific anatomical features: (3) the start of endoturbinate II (A,D,G,J), (4) the presence of endoturbinate III (B,E,H,K), and (6) the fusion of endoturbinate III (C,F,I,L). Regions exhibiting TGFα-IR were traced as white lines onto representative sections.