
Figure 5. Localization of ATP-induced FGF2 and TGFα expression in adult mouse OE.
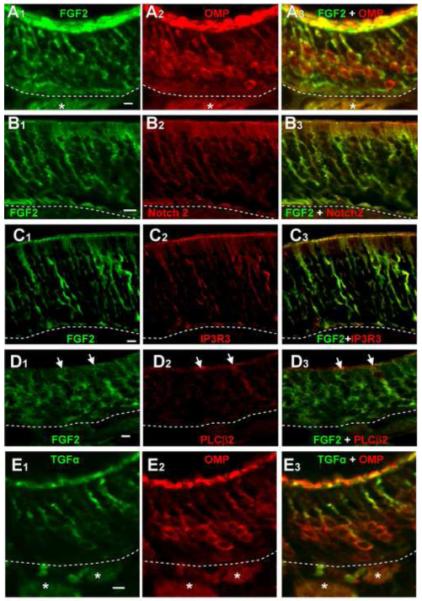
(A-D) FGF2-IR (A1, B1, C1, D1) in ATP-instilled animals co-localized with olfactory sensory neuron marker OMP-IR (A2-3), sustentacular cell marker Notch 2-IR (B2-3), and microvillous cell markers IP3R3-IR (C2-3) and PLCβ2-IR (D2-3). (F) TGFα-IR (F1) in ATP-instilled animals only co-localized with OMP-IR (E2-3). Images are Z-stack projections. *, nerve bundles. Arrows indicate immunoreactivity of representative cells. Dashed with lines indicate basement membrane. Scale bar = 5μm.