
Figure 6. Quantification of ATP-evoked growth factor upregulation in adult mouse OE.
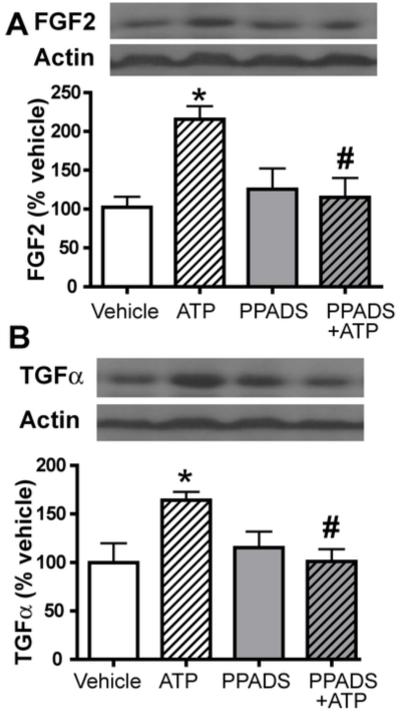
Mice were instilled with either PPADS or vehicle followed by either vehicle or ATP and tissue was collected 20 h post-ATP instillation and processed with western blot analysis for (A) FGF2 and (B) TGFα expression. Top panels show western blot and lower panels show bar graphs of normalized immunoreactivity. *, p<0.05 v. vehicle. #, p<0.05 v. ATP.