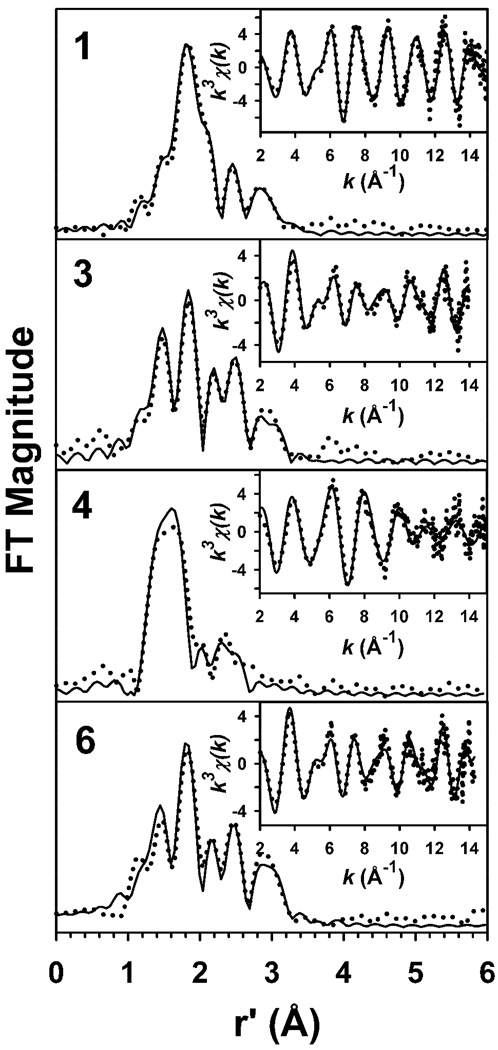
Figure 8.
Fourier transforms of the Fe K-edge EXAFS data (k3χ(k)) and unfiltered EXAFS spectra (k3χ(k), inset) obtained for 1, 3, 4, and 6. Experimental data is shown with dotted lines (•••••), while fits are shown with solid lines (——). Fourier transformation ranges are as follows: k = 2 – 15 Å−1 (1), k = 2 – 14 Å−1 (3), k = 2 – 14.95 Å−1 (4), k = 2 – 14.3 Å−1 (6). Fit parameters are shown in bold italics in Table 4.

