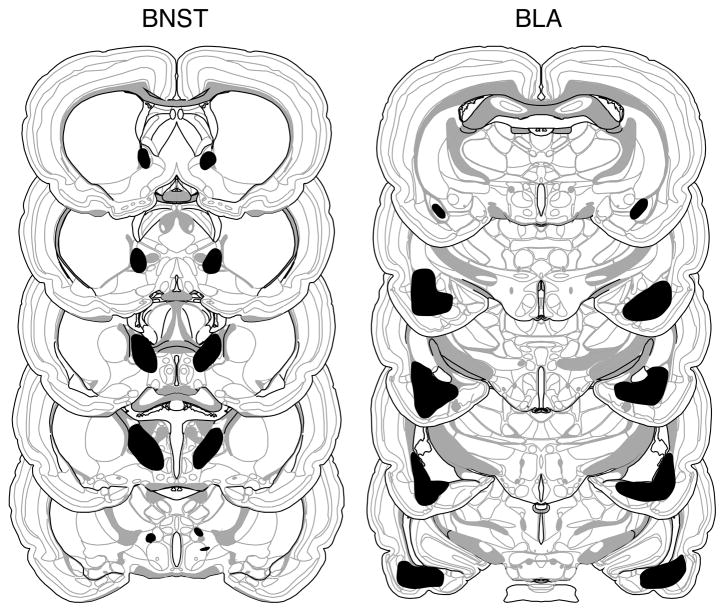
Figure 1.
Schematic representation of the extent of NMDA lesions in the BNST (left panels) and BLA (right panels) (Experiment 1). A representative lesion (black shading) is shown from a rat in the BLA-BNST group. The extent of the BNST and BLA lesions in this rat were typical of those of others in the BLA-SH and SH-BNST groups. Coronal brain section images adapted from Swanson (2003).

