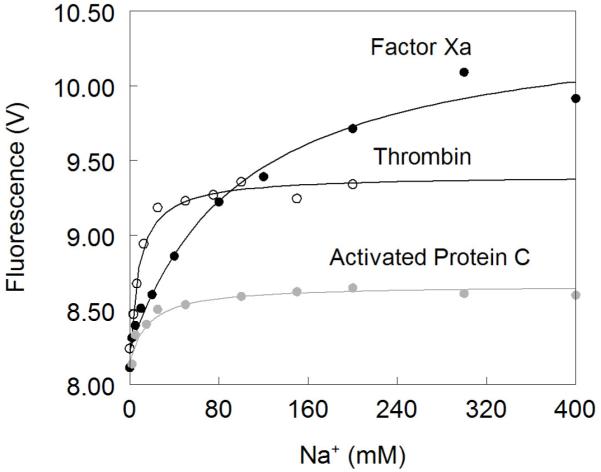
Figure 3. Na+ binding to thrombin (open circles), factor Xa (black circles) and activated protein C (grey circles).

Na+ binding curves were obtained from the total change in intrinsic fluorescence determined by stopped-flow kinetics. Experimental conditions are: 100 nM enzyme, 50mM Tris, 0.1% PEG8000, pH 8.0, at 15 °C. Continuous lines were drawn according to eq 1 in the text with best-fit parameter values listed in Table 1. Note how the Na+ affinity is highest for thrombin and lowest for factor Xa, which however shows the largest change in intrinsice fluorescence upon Na+ binding.
