Figure 2.
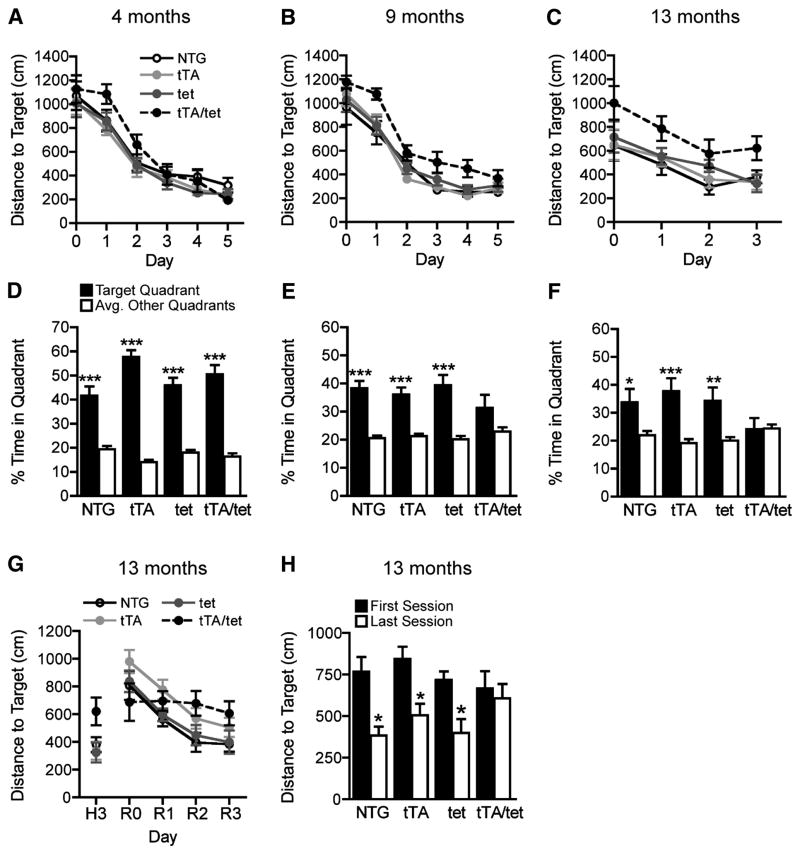
EC-APP mice have age-dependent deficits in spatial learning and memory. At 4 (A), 9 (B) and 13 (C) months of age, mice of the four genotypes were trained for 3–5 days to locate a hidden platform in the MWM. The time (not shown) and path length (distance) to reach the hidden platform were recorded. By 9 months, EC-APP (tTA/tet) mice showed impaired learning relative to the other groups (p<0.001 for genotype by repeated-measures ANOVA). Their learning deficits persisted at 13 months (p<0.01 for genotype by repeated-measures ANOVA). Latencies to reach the platform revealed similar learning deficits in EC-APP mice, and swim speeds did not differ among the groups (data not shown). (D–F) For each age group, probe trials (platform removed) were conducted 24h after the last training session. At 4 months, all groups showed a clear preference for the target quadrant, suggesting normal learning and memory retention. At 9 months, only EC-APP mice failed to spend significantly more time in the target quadrant than in the other quadrants. At 13 months, EC-APP mice spent comparable proportions of time in target and non-target quadrants, whereas the other groups still favored the target quadrant. (G–H) EC-APP mice have deficits in a spatial reversal-learning task. After the probe trial in (F), the location of the platform was changed and mice were trained for another 3 days to locate the new platform location (reversal phase). (G) In contrast to the control groups, EC-APP mice failed to improve their performance during the learning phase of this reversal task (p<0.0005 for effect of training day by repeated-measures ANOVA in the control groups only). (H) Distances to the new target location were shorter in the last than the first training sessions in the control groups, but not in EC-APP mice. *p<0.05, **p<0.005, ***p<0.0005 vs. the average percent time spent in nontarget quadrants by t test (D–F) or vs. the first session by t test (H). n=10–13 mice/group. Values are mean ± SEM.

