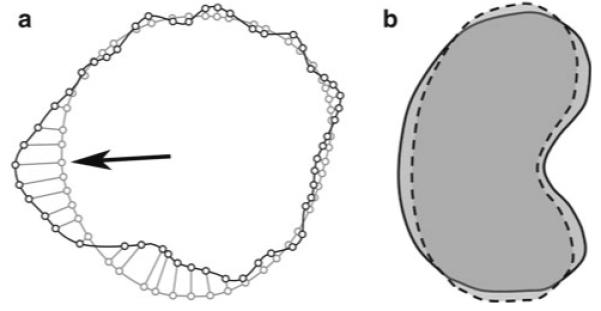
Fig. 3.

a Hausdorff Distance is the maximum perpendicular distance between closest points from two contours of registered images. Black line represents a renal contour from one image and gray line represents a renal contour from another registered image. Small circles represent corresponding closest points between each contour. Hausdorff distance represents the distance between small circles at black arrow. b Dice coefficient similarity (DSC) is an index of overlap of two different volumes. Solid black line represents a renal volume from one image and dotted black line represents a renal volume from another image after registration. DSC is always between 0 and 1; higher DSC indicates better match between the two different volumes
