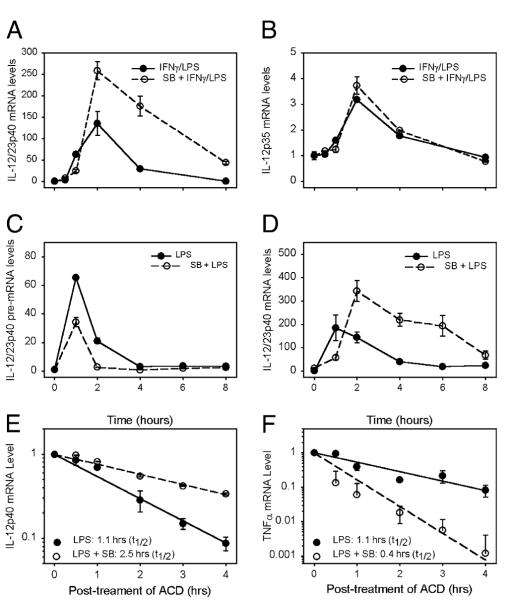
FIGURE 2.
MAPK/p38 inhibition increases IL-12p40 production via an accumulation of IL-12p40 mRNA. A, and B, BMMφs (3 × 10⁵ cells) were pretreated with SB203580 (엯, dashed line), or saline (●, solid lines) for 1 h and then stimulated with IFN-γ (100 U/ml) and LPS (10 ng/ml). Cytoplasmic RNAs were isolated at the designated times, and real-time PCR was performed to detect the presence of IL-12p40 mRNA (A) and IL-12p35 mRNA (B). Data are expressed as fold increase relative to unstimulated cells. C and D, Macrophages (4 × 10⁶ cells) were pretreated with SB203580 (5 μM) (dashed line, 엯) or with saline (solid line, ●) and then stimulated with LPS (10 ng/ml). Cytoplasmic and nuclear RNA were isolated at different times as indicated. Real-time PCR was performed to detect the presence of IL-12p40 pre-mRNA (C) and IL-12p40 mature mRNA (D). Data are expressed as fold increase relative to unstimulated cells. E and F, Macrophages were pretreated with drug vehicle (solid line with ●) or SB203580 (5 μM) (dashed line with 엯) for 1 h and stimulated with LPS (10 ng/ml) for 2 h. Actinomycin D (10 μg/ml) was added and RNA was isolated at the indicated times. Quantitative real-time PCR was performed to analyze the mRNA stability of IL-12p40 (E) and TNF-α (F), and data are presented in arbitrary units on a log scale. Data represent one of three independent experiments (mean ± SD of triplicate determinations).

