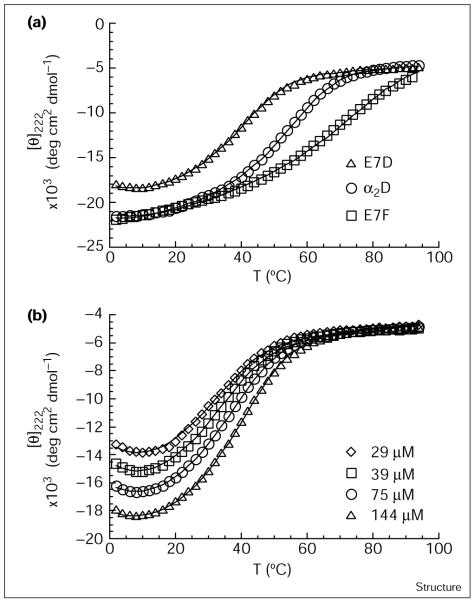
Figure 3.
Thermal denaturation of α2D and two variants. (a) Temperature dependence of the helical CD signal at 222 nm for α2D (93 μM), E7D (144 μM), and E7F (82 μM) in 50 mM Na2HPO4 pH 7.3. (b) Temperature dependence of the helical CD signal at 222 nm for E7D at 29 μM, 39 μM, 75 μM, and 144 μM. Because of the oligomeric nature of these peptides, the CD signal is concentration-dependent. In both panels, data were fit to the Gibbs-Helmholtz equation and the best fit is shown as a line (see text).

