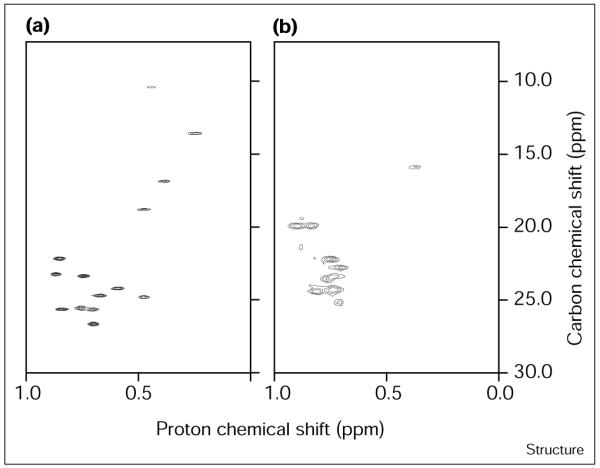
Figure 6.

Ability of the hydrophobic core of α2D and E7V to adopt a unique conformation as assessed by 2D 1H–13C NMR spectroscopy at 500.13 MHz. The methyl region of the HSQC spectra is shown at 2 mM monomer concentration in 50 mM H2NaPO4, pH 7.3 for (a) α2D and (b) E7V at the temperature of maximum thermal stability. Note the broadening of resonances and collapse of chemical shift dispersion for E7V compared with α2D. The number of methyl groups is 14 for α2D and 16 for E7V.
