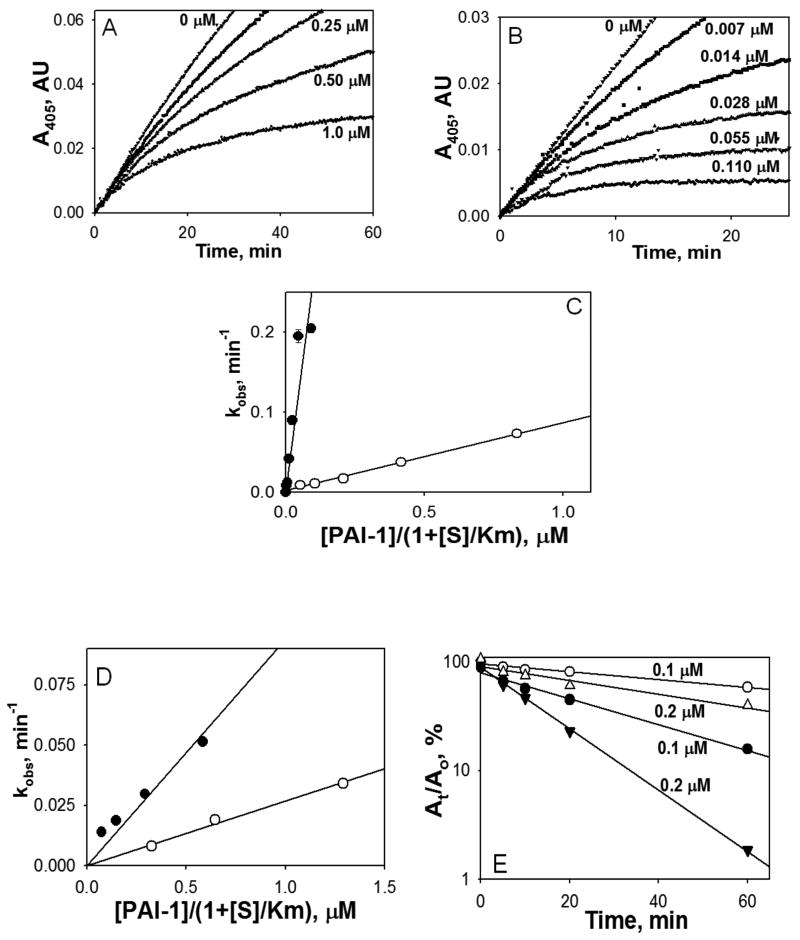
Fig. 4.
Effects of vitronectin on inhibition of FVIIa-TF by PAI-1. Varying concentrations of PAI-1 alone (0 -1.0 μM) (A) or PAI-1 with equimolar concentration of vitronectin (0-0.11 μM) (B) were added to FVIIa (2.5 nM) complexed with relipidated TF (5 nM) in the presence of 0.5 mM chromogenic substrate. FVIIa amidolytic activity was detected via accumulation of 4-nitraniline as an increase in the A405. (C) The values of kobs were calculated by fitting a single exponential equation to the traces observed in panels A and B. The values of kobs were plotted versus an effective inhibitory concentration of PAI-1 or its complex with vitronectin ([PAI-1]/(1+ [S]/Km); where S is substrate, and Km is the Michaelis constant for hydrolysis of S by FVIIa-TF. Solid lines represent best fits of the linear equation. Open symbols depict PAI-1 and closed symbols denote PAI-1 + vitronectin. (D) Same as in panel C except that the values of kobs were calculated by fitting a single exponential equation to the traces observed for inhibition of FVIIa bound to soluble TF (not shown). (E) Inactivation of FVIIa (10 nM) complexed with soluble TF (50 nM) by 0.1 (○, ●) and 0.2 μM (△, ▲) PAI-1 with (filled symbols) or without (empty symbols) vitronectin measured by an end point assay as described under Material and Methods. Residual amidolytic activity of FVIIa was plotted against time in semilogarithmic scale. Solid lines represent the best fit of the linear equation to the data.

