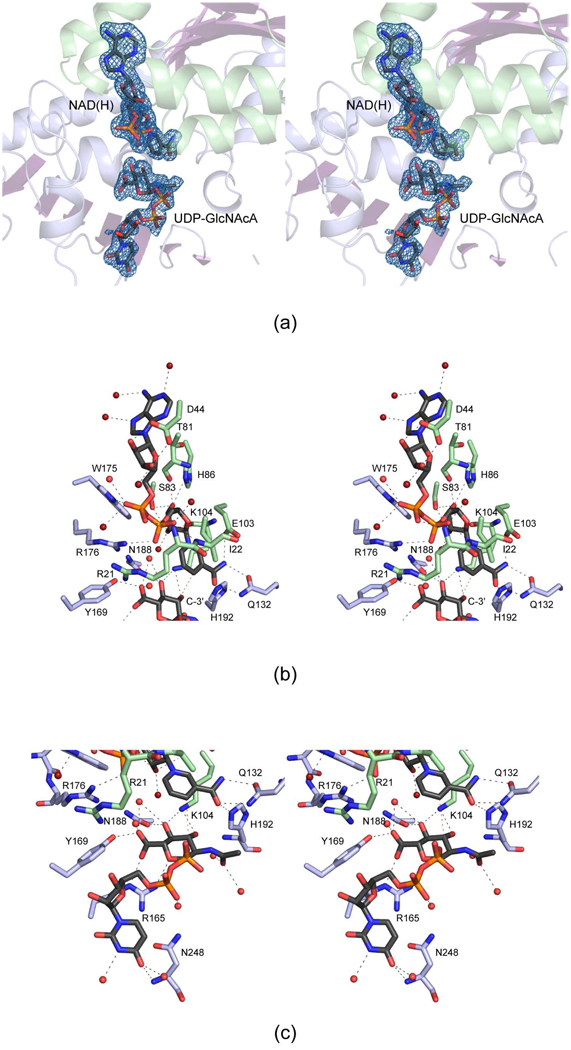
Figure 5.
The active site for the C. violaceum WlbA. Electron densities corresponding to the bound ligands are shown in (a). The electron density map, contoured at 2.5 σ, was calculated with coefficients of the form (Fo - Fc), where Fo was the native structure factor amplitude and Fc was the calculated structure factor amplitude. A close-up view of the active site near NAD(H) is depicted in (b). The dashed lines indicate possible hydrogen bonds. Water molecules are represented as red spheres. The residues colored in green and blue belong to the N- and C-terminal domains, respectively. The red dashed line between the hexose C-3' carbon and the nicotinamide C-4 carbon illustrates how the sugar moiety is ideally oriented in the active site for direct hydride transfer. A close-up view of the active site near the UDP-GlcNAcA ligand is presented in (c).

