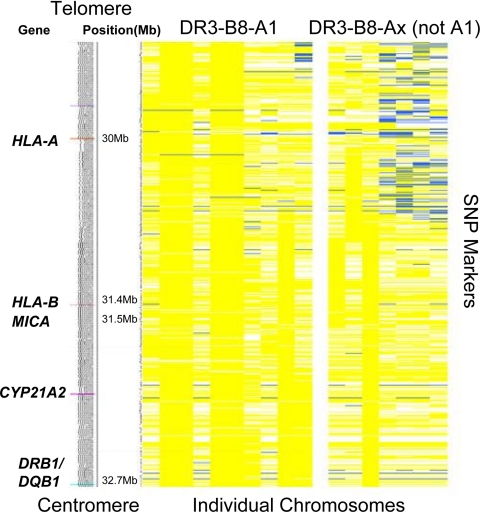
Figure 4.
Schematic of the MHC region including gene position based on National Center for Biotechnology Information Human Genome build 36 (left panel) and SNP analysis of DR3 chromosomes of patients with Addison’s disease (right panel). Each column represents a single DR3 chromosome from a patient with Addison’s disease [on the left are chromosomes with HLA-B8 and A1 (10 total); on the right are chromosomes with HLA-B8 but lacking HLA-A1 (7 total)]. Each row represents a SNP with the allele in yellow if identical with the allele on the conserved DR3-B8-A1 extended haplotype and in blue if the opposite allele. White represents missing data (see Patient Populations and Methods). The common region of conservation in patients with Addison’s disease extends from HLA-DRB1 to just beyond HLA-B.

