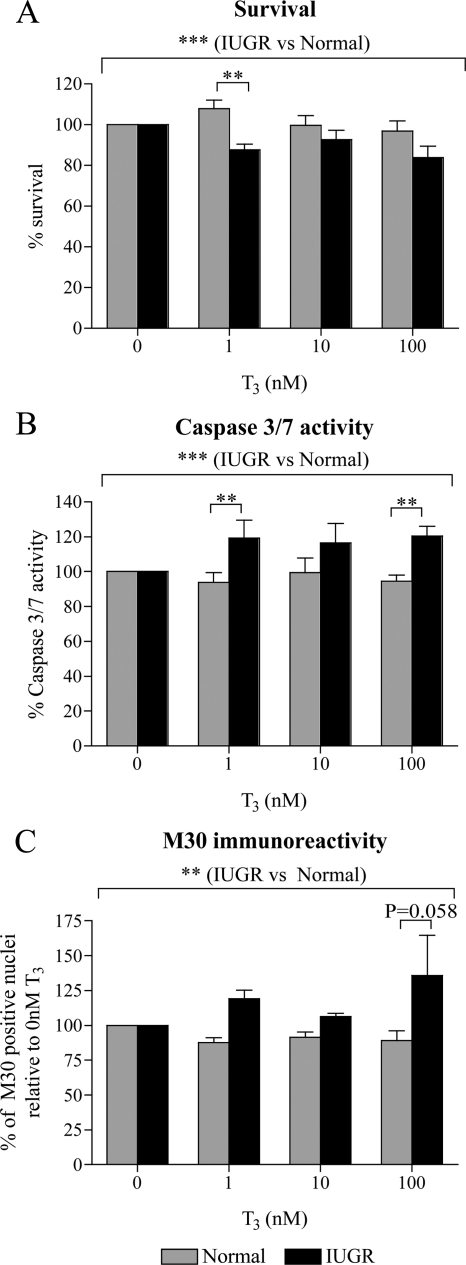
Figure 2.
Effect of T3 on the survival and apoptosis of normal and IUGR cytotrophoblasts. Survival and apoptosis were assessed after 48 h of treatment with 0, 1, 10, or 100 nm T3. Within each experiment, results were compared with that after no T3 treatment (0 nm), which was given an arbitrary value of 100%. A, Cytotrophoblast survival assessed using the MTT assay (normal, n = 9; IUGR, n = 5). B, Apoptosis assessed using the caspase 3/7 activity assay (normal, n = 9; IUGR, n = 5). C, Apoptosis assessed by immunofluorescent staining for M30 (normal, n = 4; IUGR, n = 3). **, P < 0.01; ***, P < 0.001.

