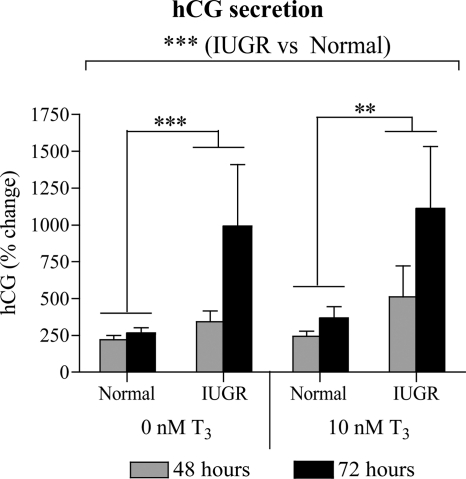
Figure 3.
Effect of T3 on hCG secretion by normal and IUGR cytotrophoblasts. The hCG secretion at 48 h after T3 treatment (normal, n = 9; IUGR, n = 6) and 72 h after T3 treatment (normal, n = 8; IUGR, n = 6) was assessed and normalized to the hCG secretion at 0 h of T3 treatment (18 h after culture), which was given an arbitrary value of 100%. **, P < 0.01; ***, P < 0.001.

