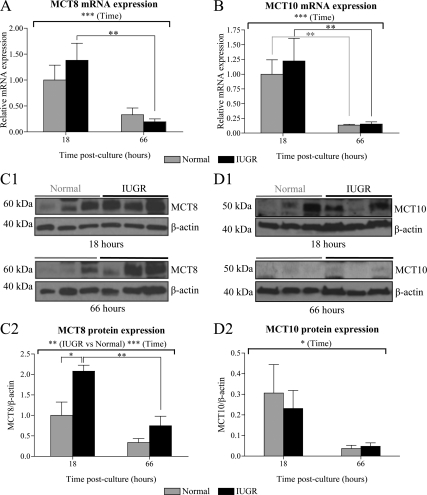
Figure 5.
MCT8 and MCT10 expression in primary cultures of normal and IUGR cytotrophoblasts. Relative expression of MCT8 (A) and MCT10 (B) mRNA (mean ± sem) was assessed at 18 and 66 h after culture. The mean mRNA expression in normal samples at 18 h after culture was given an arbitrary value of 1 (normal, n = 8; IUGR, n = 8). Western immunoblotting for MCT8 (C1) and MCT10 (D1) on whole protein lysates obtained at 18 and 66 h after culture. Bands representing MCT8 and MCT10 were detected at approximately 60 and 50 kDa, respectively. Immunoblotting for β-actin on the same membranes was used to assess protein loading. The protein expression of MCT8 (C2; normal, n = 6; IUGR, n = 5) and MCT10 (D2; normal, n = 3; IUGR, n = 3) were quantified by relative densitometry and shown as a ratio to β-actin protein expression (mean ± sem). *, P < 0.05; **, P < 0.01; ***, P < 0.001.

