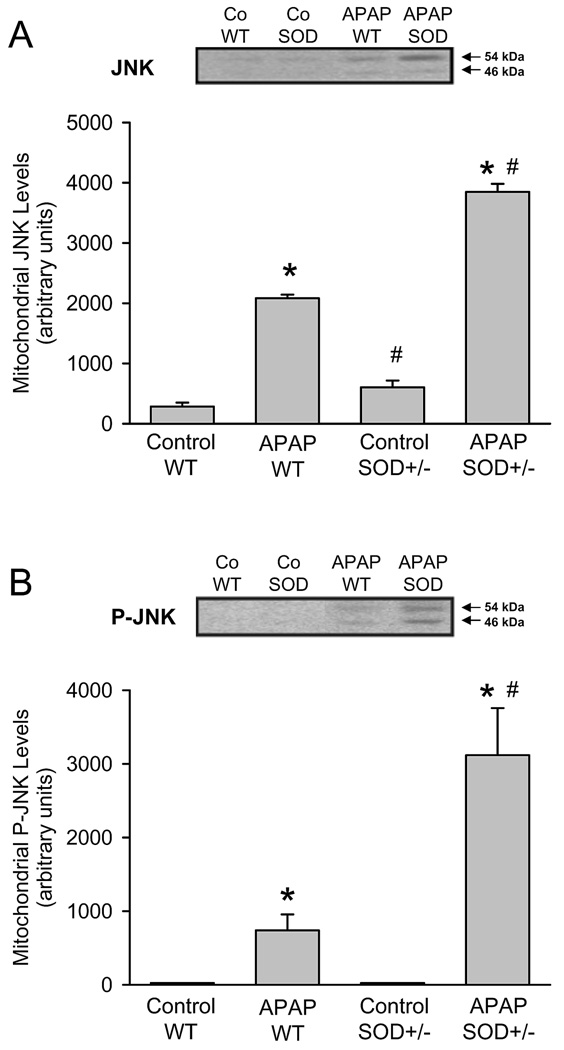
Figure 5.
Western blot analysis and densitometric quantitation of c-Jun-N-terminal Kinase (JNK) (A) and the activated form phospho-JNK (P-JNK) (B) in the mitochondrial fraction from untreated controls and 6 h after 200 mg/kg APAP in wild type (WT) and SOD2-deficient (SOD+/−) mice. Data represent means ± SE of n = 3 animals per group. *P<0.05 (compared to untreated controls), #P<0.05 (compared to APAP treated wild type mice).

