
Figure 1.
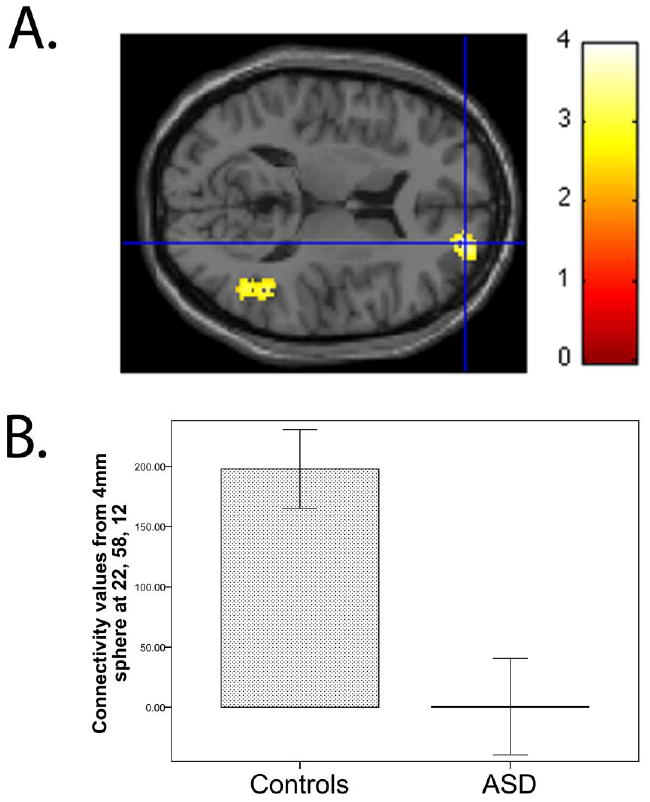
(A) Relative to control group, the ASD group showed weaker connectivity of the posterior hub with the right superior frontal gyrus (cluster size = 584 voxels, peak voxel at xyz = 22, 58, 12, t78 = 3.91, p = .037, small volume corrected for the right superior frontal gyrus). For illustration purposes, the threshold was set at p < 0.01 for the images. (B) To depict connectivity for each subject, z values (scaled by a factor of 100) were extracted from a sphere with a radius of 4 mm around the peak. Means for the control and ASD groups are shown in the bar graph. Error bars indicate the standard error of the mean.