
Figure 2.
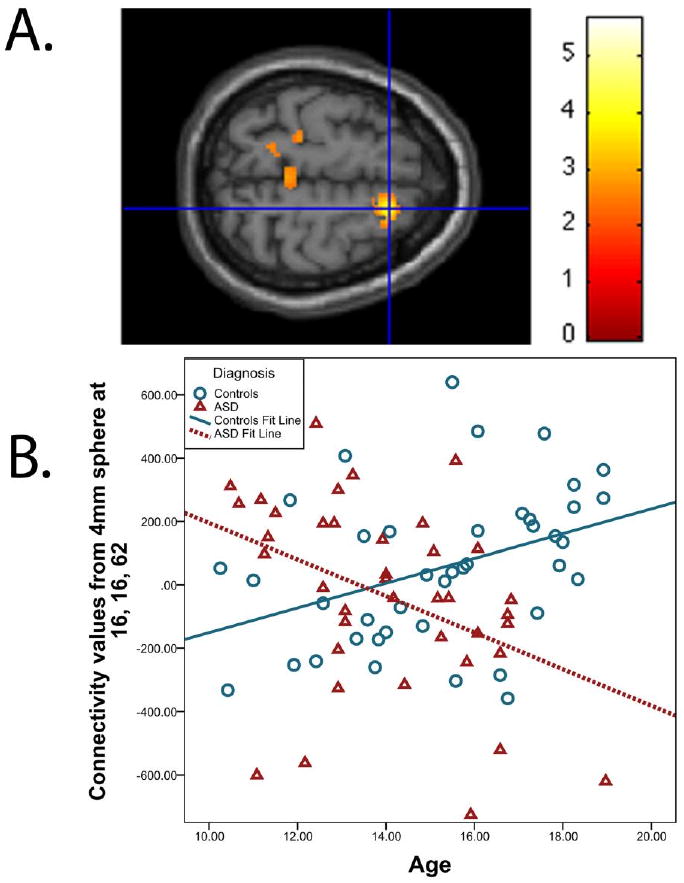
(A) A significant age by diagnosis interaction was detected in the right superior frontal gyrus (cluster size = 402 voxels, peak voxel at xyz = 16, 16, 62, t76 = 3.88, p = .041, small volume corrected for the right superior frontal gyrus). For illustration purposes, the threshold was set at p < 0.01 for the images. (B) To depict connectivity for each subject, z values (scaled by a factor of 100) were extracted from a sphere with a radius of 4 mm around the peak. The scatterplot shows the relationship between age and right superior frontal gyrus connectivity in controls and the ASD group.