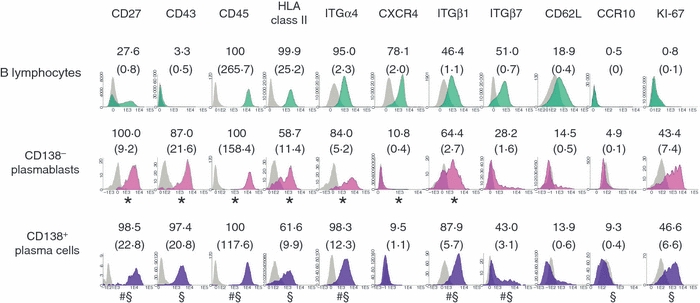
Figure 2.

Expression of activation and homing molecules by peripheral blood (PB) mobilized B lymphocytes and mobilized CD138− plasmablasts or CD138+ plasma cells. Detailed immunophenotypic profiles of B lymphocytes and both CD138− plasmablasts and CD138+ plasma cells in leukapheresis samples from healthy donors analysed by multiparameter flow cytometry were obtained. The phenotypic profiles of B lymphocytes and both CD138− plasmablasts and CD138+ plasma cells were defined after gating on CD19+CD20+CD38−/+CD138− B lymphocytes (green histograms), and both CD19−/+CD20−CD38++CD138− (pink histograms) and CD19−/+CD20−CD38++CD138+ (purple histograms) cells, respectively. Grey histograms display the corresponding negative control for the same cell populations. Data from one experiment representative of between six and 30 experiments are shown. Values displayed in each panel indicate the mean percentage of positive cells from the gated cell population and the mean staining index obtained for each specific monoclonal antibody (mAb) used is shown in brackets. *, # or § indicates a significant difference in the staining index (P≤ 0.05; paired Student’s t-test) between B lymphocytes and CD138− plasmablasts (*), between CD138− plasmablasts and CD138+ plasma cells (#), and between B lymphocytes and CD138+ plasma cells (§).
